
1
Follow
1781
Followers
Aperçu
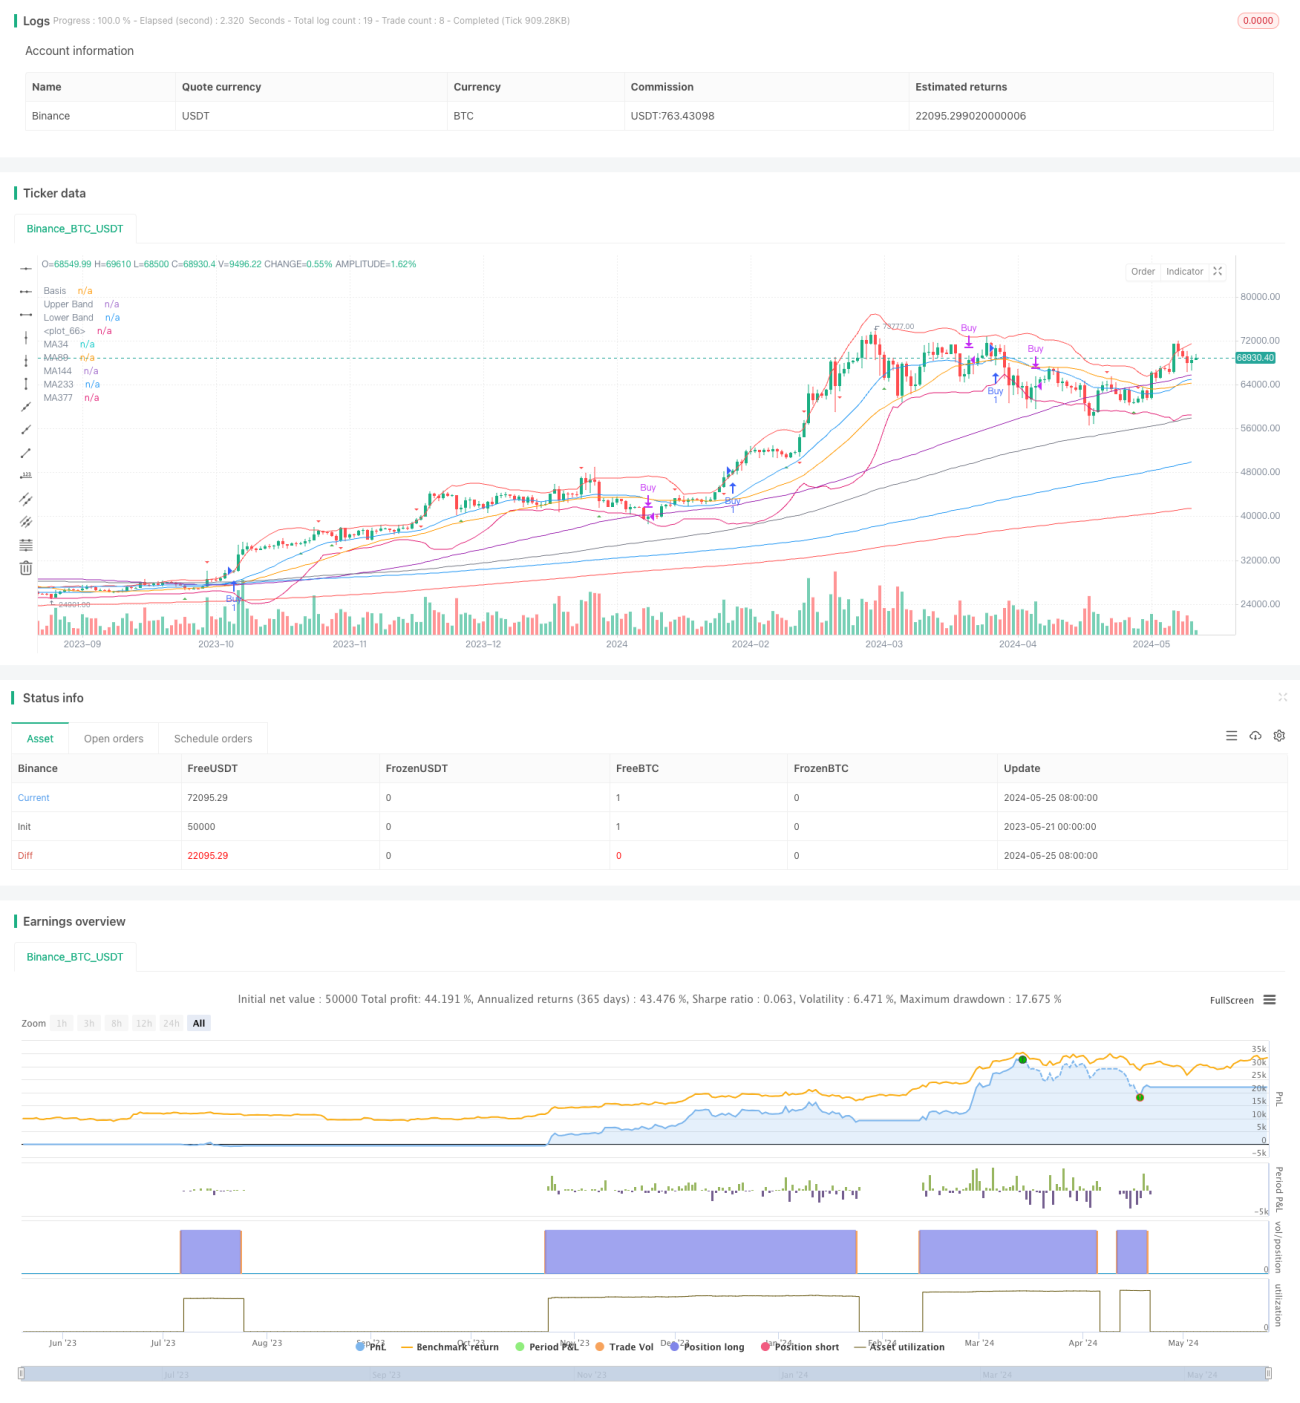
Cette stratégie combine les bandes de Brin, le RSI, plusieurs moyennes mobiles et le MACD pour construire un système de trading complet. Tout d'abord, les fluctuations des prix sont jugées par les bandes de Brin et la position du prix par rapport à la bande de Brin est utilisée pour déterminer la tendance.
Principe de stratégie
- La courbe de Brin, avec 20 cycles et 2 fois la défaillance de la norme, est utilisée pour déterminer la tendance en fonction de la position du cours de clôture par rapport à la courbe de Brin.
- Calculer le RSI à 14 cycles et juger de la survente et de la survente par le croisement du RSI avec les niveaux 30 et 70 pour identifier un potentiel renversement.
- Les moyennes mobiles simples des cycles 34, 89, 144, 233, 377 et 610 sont calculées et la tendance est confirmée par la mise en place d'un alignement à plusieurs têtes de la moyenne, qui peut également servir de résistance de support.
- Le calcul de l'indicateur MACD est basé sur les paramètres 12, 26 et 9 et aide à déterminer le renversement de tendance en croisant l'axe 0 avec la colonne MACD.
- En analysant les indicateurs ci-dessus, on peut établir une logique de placement en bourse:
- Ouverture de position: ouverture d'une position de plus lorsque le cours de clôture est au-dessus de la courbe moyenne de Brin et que la courbe moyenne à court terme est au-dessus de la courbe moyenne à long terme
- Placement à l'écart: placement à l'écart de la moitié de la position lorsque le cours de clôture tombe en dessous de l'orbite moyenne de la ceinture de Brin et de la totalité de la position lorsque la moyenne à court terme tombe en dessous de la moyenne à long terme.
Avantages stratégiques
- Les courbes de Brin permettent de quantifier objectivement les fluctuations de prix et de fournir une base pour les jugements de tendance.
- L'introduction de l'indicateur RSI aide à juger si le marché est trop acheté ou trop vendu et à saisir les opportunités potentielles de renversement de tendance.
- Les combinaisons de plusieurs lignes normales permettent une analyse plus complète des tendances à différentes échelles de temps.
- L'indicateur MACD peut être utilisé comme aide pour juger de la tendance et de la reprise, ce qui améliore la fiabilité du signal.
- La logique d'ouverture de position inclut la gestion de la position, qui consiste à réduire progressivement la position pour contrôler le risque en cas d'incertitude de tendance.
Risque stratégique
- Dans le cas d'un tremblement de terre, les signaux de la bande de Brin et du système homogène peuvent être fréquents et contradictoires.
- Les indices RSI et MACD peuvent rester dans des zones de survente et de surachat pendant une période prolongée dans un contexte de forte tendance.
- Le choix des paramètres (par exemple, les périodes des bandes de Bryn, les périodes de la moyenne) est subjectif, et différents paramètres peuvent entraîner des résultats différents.
- L'absence d'un mécanisme de stop-loss peut entraîner une augmentation du risque d'une seule transaction.
- La réaction à des situations extrêmes telles que la vague de chaleur noire pourrait être insuffisante et entraîner un retrait plus important.
Orientation de l'optimisation de la stratégie
- Optimisation plus systématique des paramètres des différents indicateurs, tels que la période et la largeur de la bande de Brin, la période et les seuils du RSI, etc.
- L'introduction d'autres signaux de confirmation, tels que les changements de volume, améliore la fiabilité des signaux.
- La mise en place de mécanismes de stop loss et de stop-loss dans les conditions d'ouverture de positions ouvertes permet de mieux maîtriser le risque d'une seule transaction.
- Considérer l'introduction d'un mécanisme d'ajustement de position, permettant de modifier la position de manière flexible en fonction des différentes conditions du marché, afin d'améliorer le ratio risque/revenu.
- La conception est adaptée aux prévisions d'événements extrêmes, comme la couverture basée sur l'indice VIX ou la pondération dynamique du facteur Alpha.
Résumer
La stratégie a construit un système de négociation relativement complet à partir de plusieurs dimensions, y compris le jugement de tendance, le jugement de survente, l'analyse à plusieurs échelles de temps, le contrôle de la position, etc. Cependant, la stratégie doit encore être optimisée pour faire face aux événements choquants et extrêmes, et manque d'optimisation des paramètres et de contrôle des risques plus systématiques.
Source
Pine
Strategy parameters
Related strategies
Comment
All comments (0)
No data
- 1