
1
Follow
1781
Followers
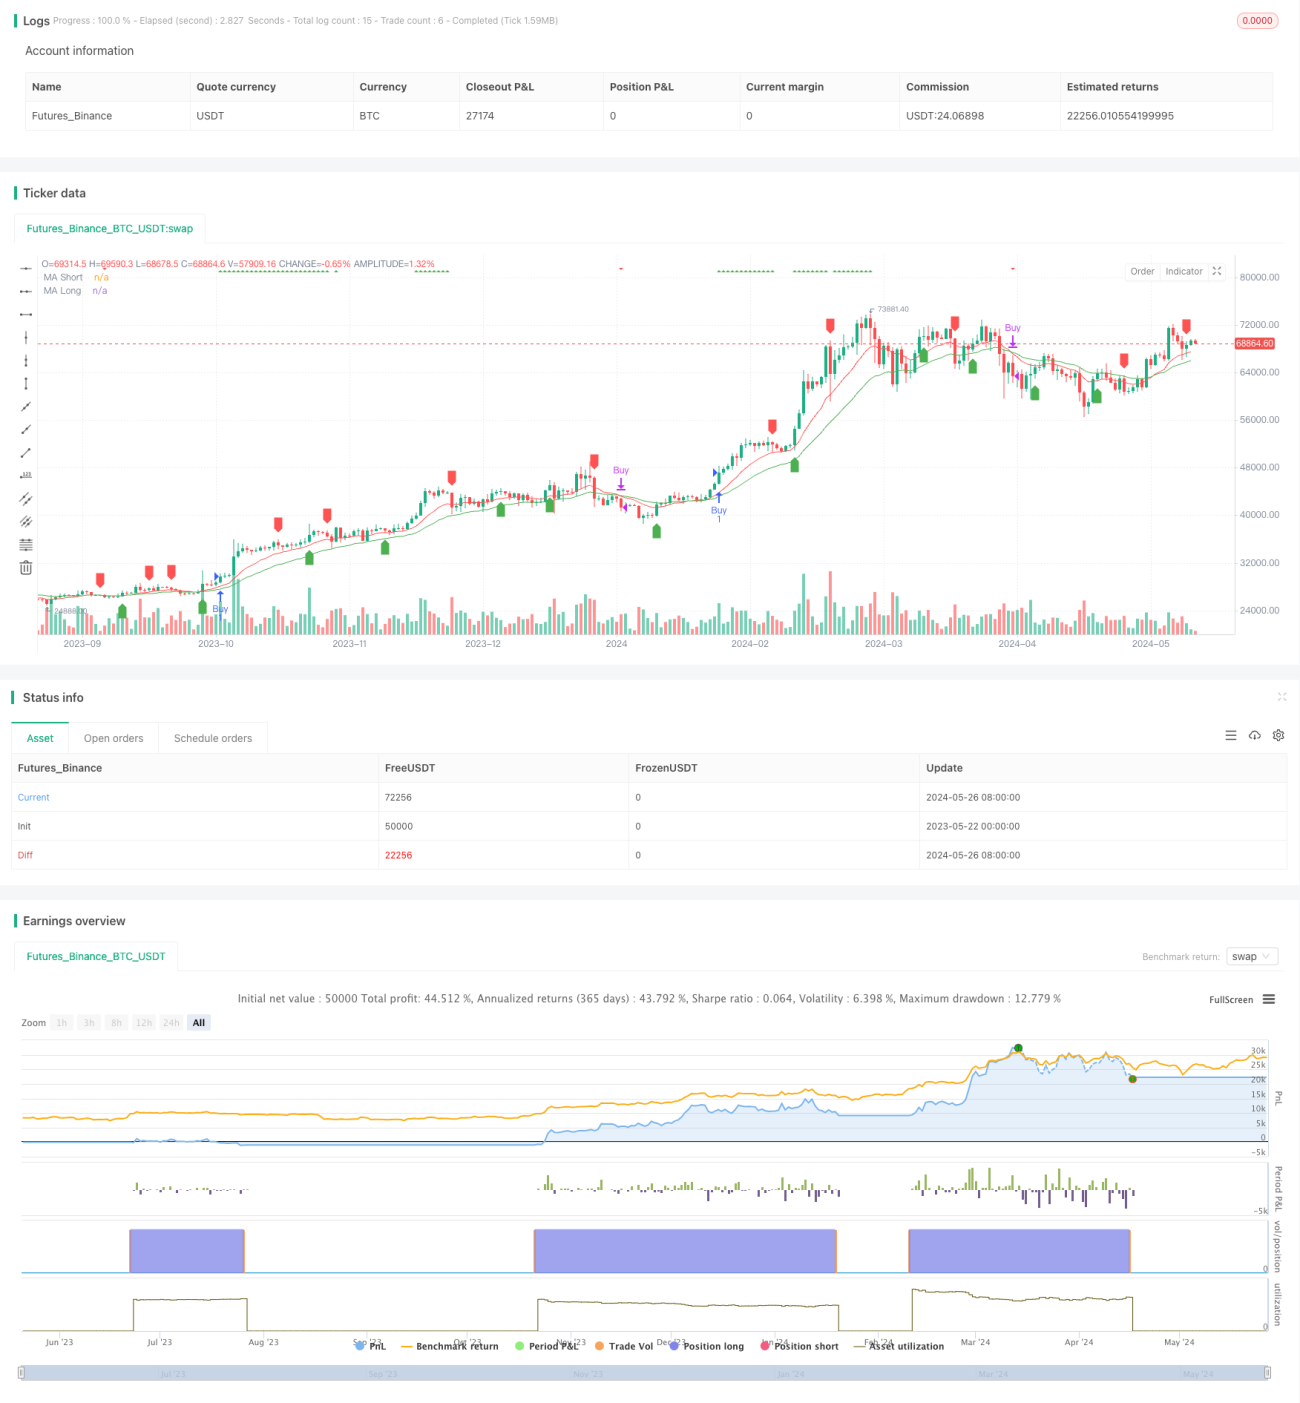
Aperçu
La stratégie combine l'indicateur RSI avec une moyenne mobile ((MA) pour générer un signal de transaction. Le RSI est utilisé pour juger si le marché est en survente ou en survente, et la MA pour juger de la tendance des prix. Il génère un signal de vente lorsque le RSI est en survente et le prix est supérieur à la MA.
Principe de stratégie
- Calculer la valeur de l'indicateur RSI pour déterminer si le marché est en survente (<70) ou en survente (<30).
- Calculer la MA de cycle personnalisé, comprenant les quatre types d'EMA, SMA, HMA et WMA, et décider si elle apparaît sur le graphique en fonction du paramètre de réglage.
- Un signal d'achat est généré lorsque le RSI est en sur-achat et que le cours de clôture est supérieur à la MA; un signal de vente est généré lorsque le RSI est en survente ou que la MA génère une fourchette morte.
- L'introduction de l'indicateur StochRSI comme jugement auxiliaire marque un indice sur le graphique lorsque le StochRSI est surbouti (<70) ou survendu (<30), mais ne génère pas de signal de transaction réel.
Avantages stratégiques
- La combinaison organique des deux indicateurs classiques RSI et MA permet de mieux saisir le moment de la tendance et le moment où il est trop acheté ou trop vendu.
- Le type et les paramètres de l'AM peuvent être réglés librement, avec une grande flexibilité, et peuvent être ajustés en fonction des différentes caractéristiques du marché.
- L'introduction de l'indicateur StochRSI comme aide à la prise de décision et comme référence supplémentaire pour les décisions de négociation.
- La logique du code est claire, lisible, facile à comprendre et à utiliser.
Risque stratégique
- Le RSI et la MA sont des indicateurs en retard et peuvent générer plus de signaux trompeurs au début d'un renversement de tendance.
- Une mauvaise configuration des paramètres peut entraîner un signal trop tôt ou trop tard, affectant les gains globaux.
- Le manque de gestion des stops et des positions peut entraîner des risques importants en cas de forte volatilité.
Orientation de l'optimisation de la stratégie
- L'introduction d'indicateurs plus avancés tels que le taux de volatilité permet d'évaluer à l'avance les changements de tendance.
- Les signaux d'achat et de vente sont filtrés, comme si le RSI et le MA remplissaient simultanément certaines conditions pour générer un signal afin d'améliorer l'exactitude du signal.
- Ajout de modules de gestion des stop-loss et des positions dans la stratégie pour contrôler les risques individuels et les risques globaux.
- Optimiser les paramètres de la stratégie pour trouver la meilleure combinaison de paramètres.
- Envisagez d'inclure différents cycles ou plusieurs variétés, en tirant le meilleur parti des relations entre les variétés ou les cycles.
Résumer
La stratégie est simple et claire. L'idée générale est simple et claire. Cependant, la stratégie présente quelques lacunes, telles que le manque de mesures de contrôle des risques, l'amélioration de l'exactitude du signal, etc.
Source
Pine
Strategy parameters
Related strategies
Comment
All comments (0)
No data
- 1