Stratégie d'optimisation du mécanisme de marché long-short basée sur la volatilité et la ligne de régression

Aperçu
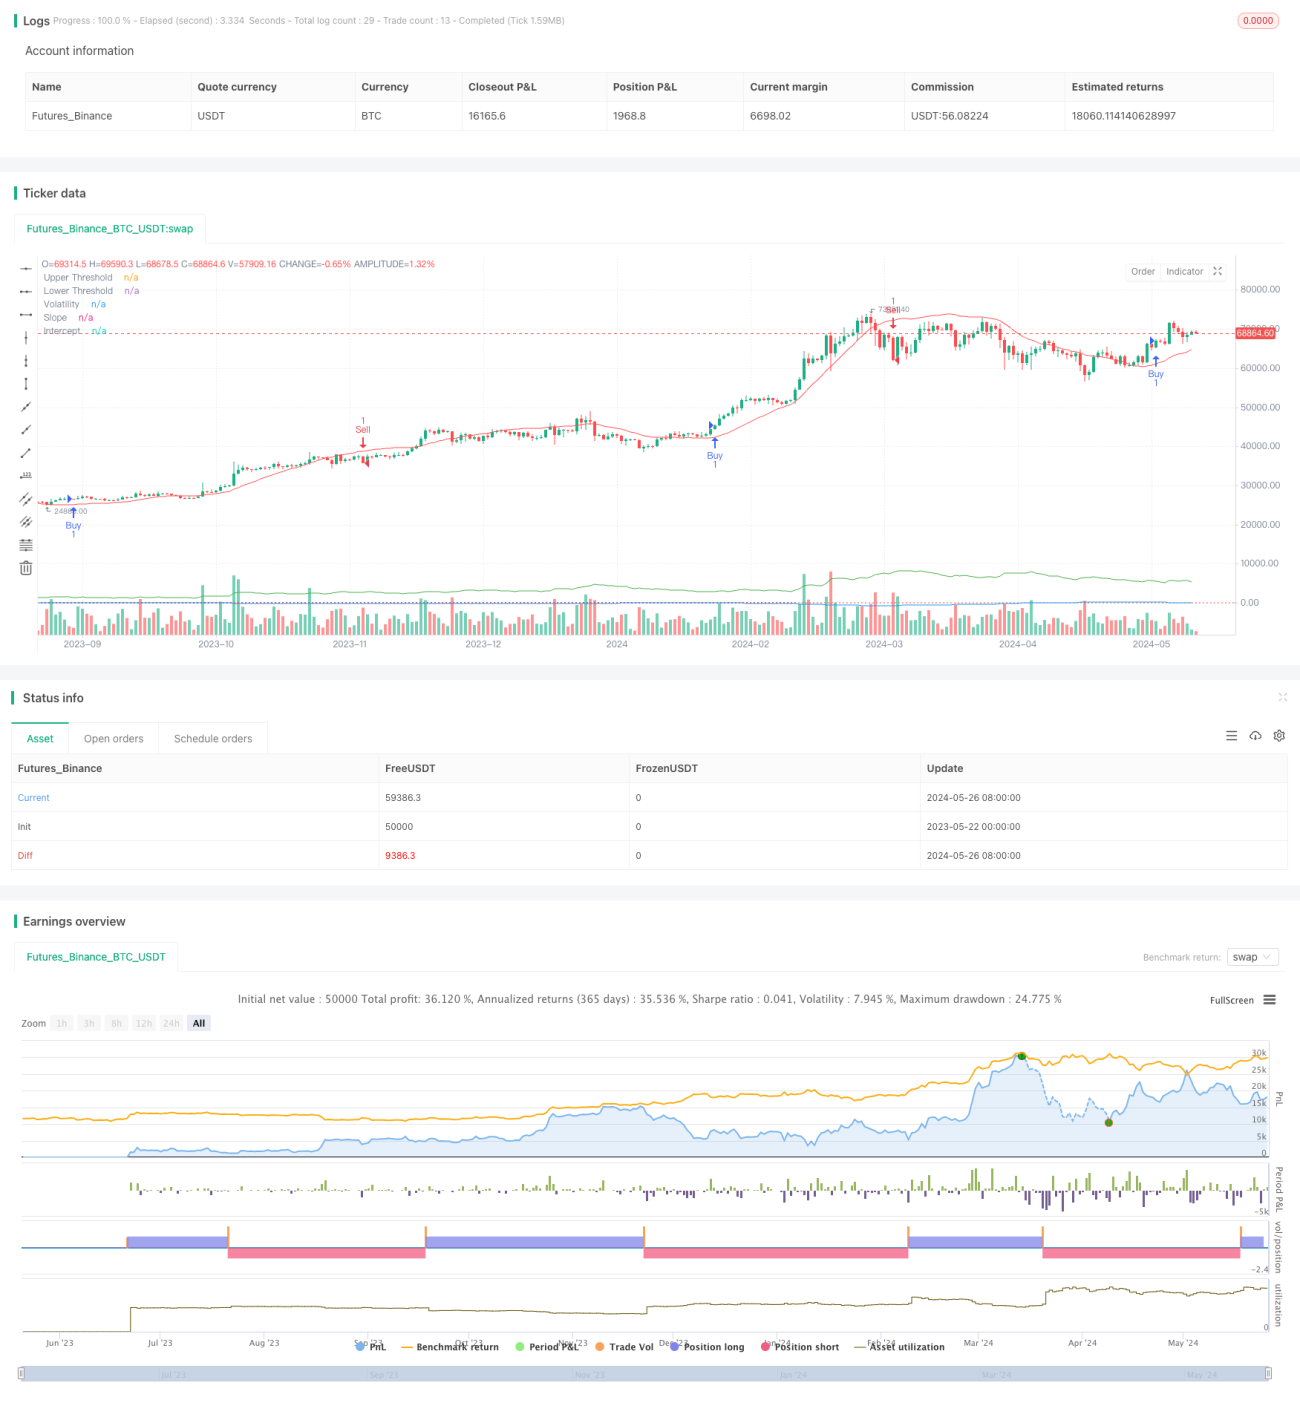
La stratégie utilise la régression linéaire et les indicateurs de volatilité pour identifier les différents états du marché. La stratégie crée des positions correspondantes en position de plus ou de moins lorsque les conditions d'achat ou de vente sont remplies. La stratégie permet également d'optimiser et d'ajuster les paramètres en fonction de la situation du marché pour s'adapter aux différents environnements.
Principe de stratégie
- Calculer la tranche et la pente de la régression linéaire pour déterminer la tendance du marché.
- Calculer le taux de fluctuation réel moyen (ATR) multiplié par le multiplicateur de l'indicateur de taux de fluctuation.
- Un signal d'achat est généré lorsque l'inclinaison est supérieure à la hausse et que le prix est supérieur à la ligne de retour plus la volatilité.
- Un signal de vente est généré lorsque l'inclinaison est inférieure à la marge baissière et que le prix est inférieur à la ligne de retour moins la volatilité.
- Utilisation des moyennes mobiles des indices rapides et lents (EMA) comme indicateur de confirmation supplémentaire.
- Lorsque le signal d'achat apparaît et que l'EMA rapide est supérieure à l'EMA lente, une position de tête multiple est créée.
- Lorsque le signal de vente apparaît et que l'EMA rapide est inférieure à l'EMA lente, une position vide est créée.
Avantages stratégiques
- La combinaison de la régression linéaire et de l'indicateur de volatilité permet d'identifier plus précisément l'état et les tendances du marché.
- L'utilisation d'indicateurs EMA additionnels pour confirmer les signaux de négociation améliore la fiabilité de la stratégie.
- Permet l'optimisation des paramètres clés pour s'adapter à différents environnements de marché et aux caractéristiques de la variété.
- En tenant compte de la tendance et de la volatilité, il est possible d'investir rapidement lorsque la tendance est claire et de contrôler le risque lorsque la volatilité augmente.
Risque stratégique
- Une mauvaise sélection des paramètres peut entraîner une mauvaise performance de la stratégie, qui doit être optimisée en fonction des variétés et des caractéristiques du marché.
- La stratégie peut être utilisée lors d'une période de turbulence ou d'un changement de tendance, avec des transactions fréquentes ou de faux signaux.
- La stratégie repose sur des données historiques et peut être retardée par des événements inattendus ou des fluctuations anormales du marché.
Orientation de l'optimisation de la stratégie
- L'introduction d'autres indicateurs techniques ou fondamentaux pour enrichir la base de décision stratégique et améliorer l'exactitude du signal.
- Optimiser les paramètres tels que la longueur de la régression, le multiplicateur de la volatilité, les cycles EMA, etc. pour s'adapter aux différentes variétés et caractéristiques du marché.
- Augmentation des mécanismes de stop-loss et de stop-loss, de contrôle du risque de transaction individuelle et du niveau de retrait global.
- Envisager d'ajouter des règles de gestion des positions et de gestion des fonds, en ajustant la taille des positions en fonction des fluctuations du marché et de l'équité du compte.
Résumer
La stratégie identifie l'état du marché à l'aide d'indicateurs de régression linéaire et de volatilité et utilise l'EMA comme indicateur de confirmation pour construire une stratégie de négociation adaptative et logiquement claire. L'avantage de la stratégie réside dans la combinaison de tendances et de volatilité, tout en permettant l'optimisation des paramètres, adaptée à différents environnements de marché.
- 1