Suivi des tendances SMA multi-échelles de temps et stratégie de stop loss dynamique

Aperçu
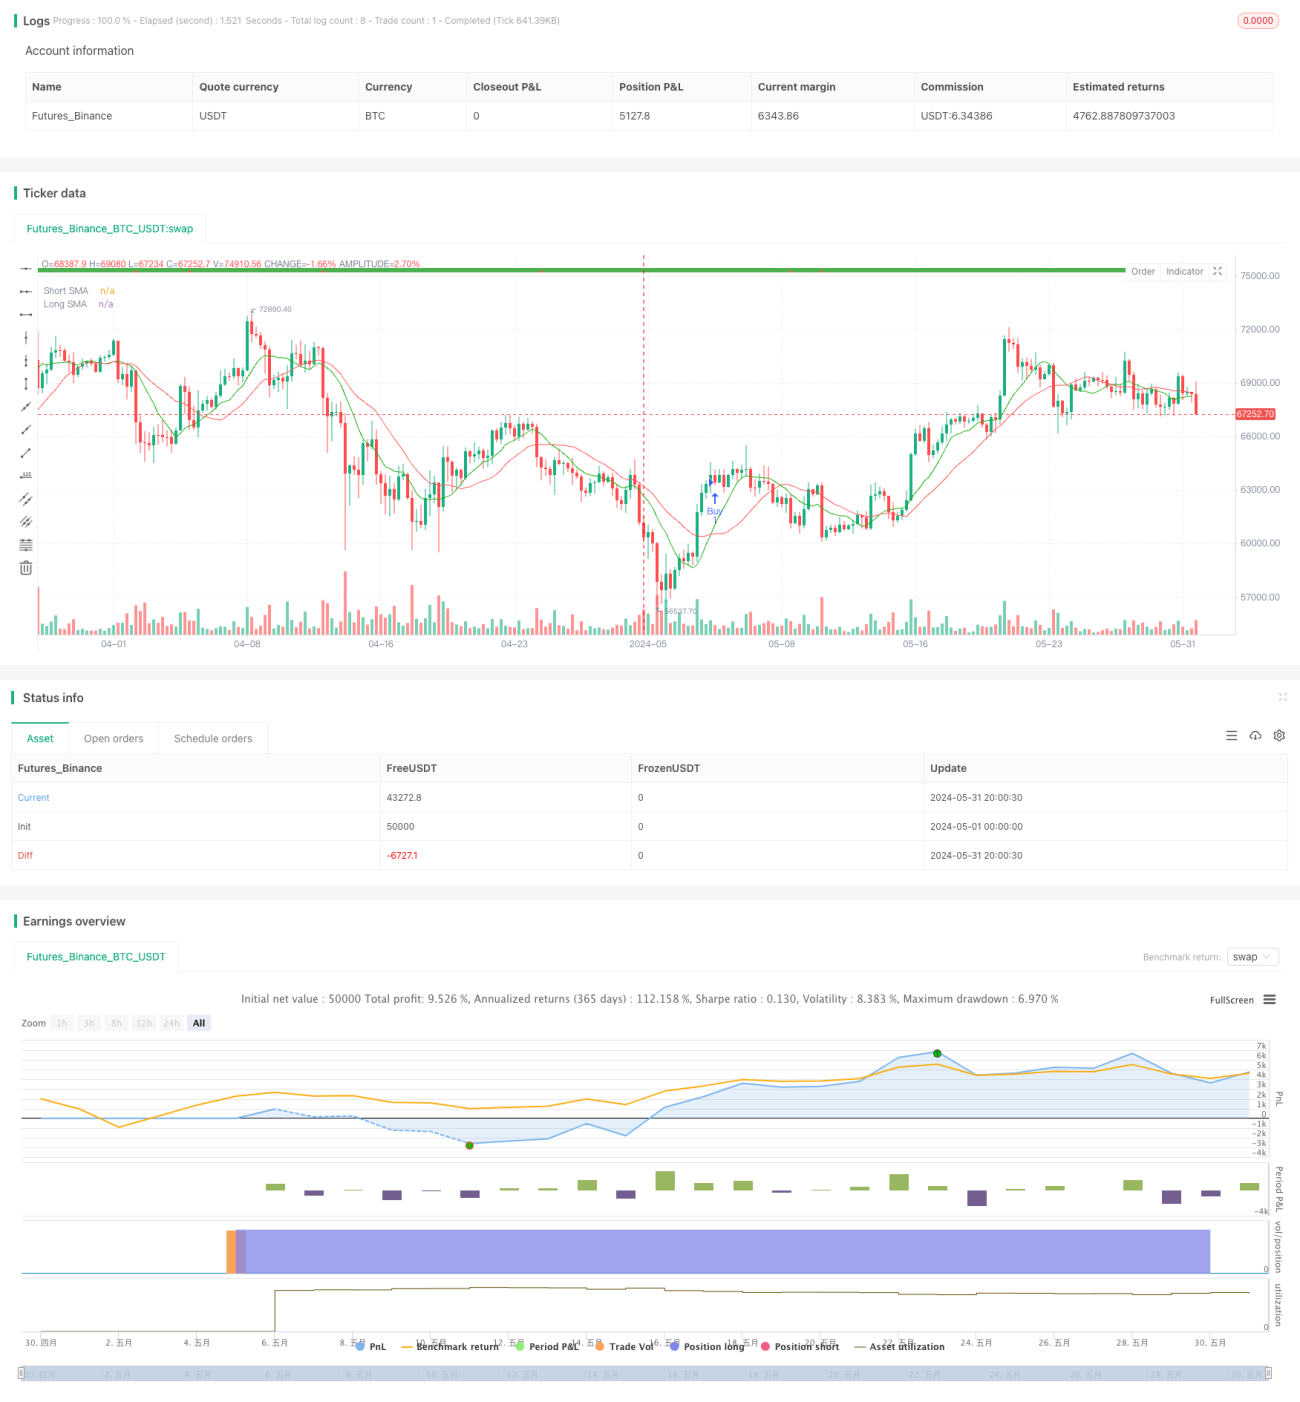
La stratégie est basée sur des moyennes mobiles simples (SMA) sur différentes échelles de temps pour capturer les tendances du marché. Elle génère des signaux d'achat et de vente en comparant les positions relatives des SMA à court et à long terme. Elle utilise également des conditions de confirmation de tendance pour filtrer les faux signaux et améliorer l'exactitude des transactions.
Principe de stratégie
- Calculer les SMA à court et à long terme pour déterminer la direction des tendances du marché.
- Un signal d'achat est généré lorsque le SMA court est porté sur le SMA long; un signal de vente est généré lorsque le SMA court est porté sur le SMA long.
- Les conditions de confirmation de la tendance sont utilisées pour filtrer les faux signaux. L'achat est effectué uniquement lorsque la tendance principale est à plusieurs têtes et la vente uniquement lorsque la tendance principale est vide.
- La fonction Stop and Loss est configurée pour contrôler le risque de transaction. Lorsque le prix atteint le niveau d'arrêt ou de perte par défaut, la position est libérée.
- Ajustez votre position dynamiquement en fonction des conditions de confirmation de la tendance. Lorsque la tendance principale change, retirez votre position en temps opportun pour éviter les pertes causées par le renversement de la tendance.
Avantages stratégiques
- Suivi des tendances: la stratégie est basée sur des SMA sur différentes échelles de temps, captant efficacement les principales tendances du marché et s'adaptant aux différentes conditions du marché.
- Confirmation de tendance: par l'introduction de conditions de confirmation de tendance, filtrer les faux signaux, améliorer la fiabilité des signaux de négociation et réduire les transactions invalides.
- Gestion des risques: fonctionnalités de blocage et d'arrêt de perte intégrées pour aider à contrôler les risques de transaction et à protéger la sécurité des fonds des investisseurs.
- Adaptation dynamique: Adaptation dynamique des positions en fonction de la confirmation de la tendance, afin de répondre en temps opportun aux changements du marché et de réduire les pertes causées par le renversement de la tendance.
Risque stratégique
- Risque d'optimisation des paramètres: la performance de la stratégie dépend du cycle SMA et du choix des paramètres d'équilibre des pertes et des pertes. Des paramètres mal configurés peuvent entraîner une mauvaise efficacité de la stratégie.
- Risque de marché de choc: dans un environnement de marché de choc, des signaux de trading fréquents peuvent conduire à des transactions excessives, augmentant les coûts et les risques de transaction.
- Risque d'événement majeur: face à un événement majeur, le marché peut être très volatile et la stratégie peut ne pas être en mesure de réagir en temps opportun, ce qui entraîne des pertes importantes.
Orientation de l'optimisation de la stratégie
- L'introduction de plus d'indicateurs techniques: en combinaison avec d'autres indicateurs techniques, tels que le MACD, le RSI, etc., améliore l'exactitude et la solidité des jugements de tendance.
- Optimisation des paramètres: recherche de la meilleure combinaison de paramètres de cycle SMA, de stop loss et d'équilibre, et amélioration de la performance de la stratégie par le retrait des données historiques et l'optimisation des paramètres.
- Amélioration de la gestion des risques: l'introduction de techniques de gestion des risques plus avancées, telles que l'arrêt dynamique des pertes, la gestion des positions, etc., permettent de contrôler davantage les risques.
- Adaptation aux différentes conditions du marché: en fonction de la volatilité du marché et de l'intensité de la tendance, les paramètres de la stratégie sont ajustés dynamiquement pour permettre à la stratégie de s'adapter aux différentes conditions du marché.
Résumer
Cette stratégie multi-échelle de suivi des tendances SMA et de stop-loss dynamique utilise les SMA de différentes échelles de temps pour capturer les tendances du marché, filtrer les faux signaux par la confirmation des conditions de tendance, tout en configurant les fonctions de suivi des tendances et de gestion des risques. Bien que la stratégie présente certains avantages, elle est toujours exposée à des risques tels que l'optimisation des paramètres, les marchés de choc et les événements soudains.
- 1