Stratégies d'achat et de vente basées sur des signaux de prix de volume et des modèles de chandeliers

Aperçu
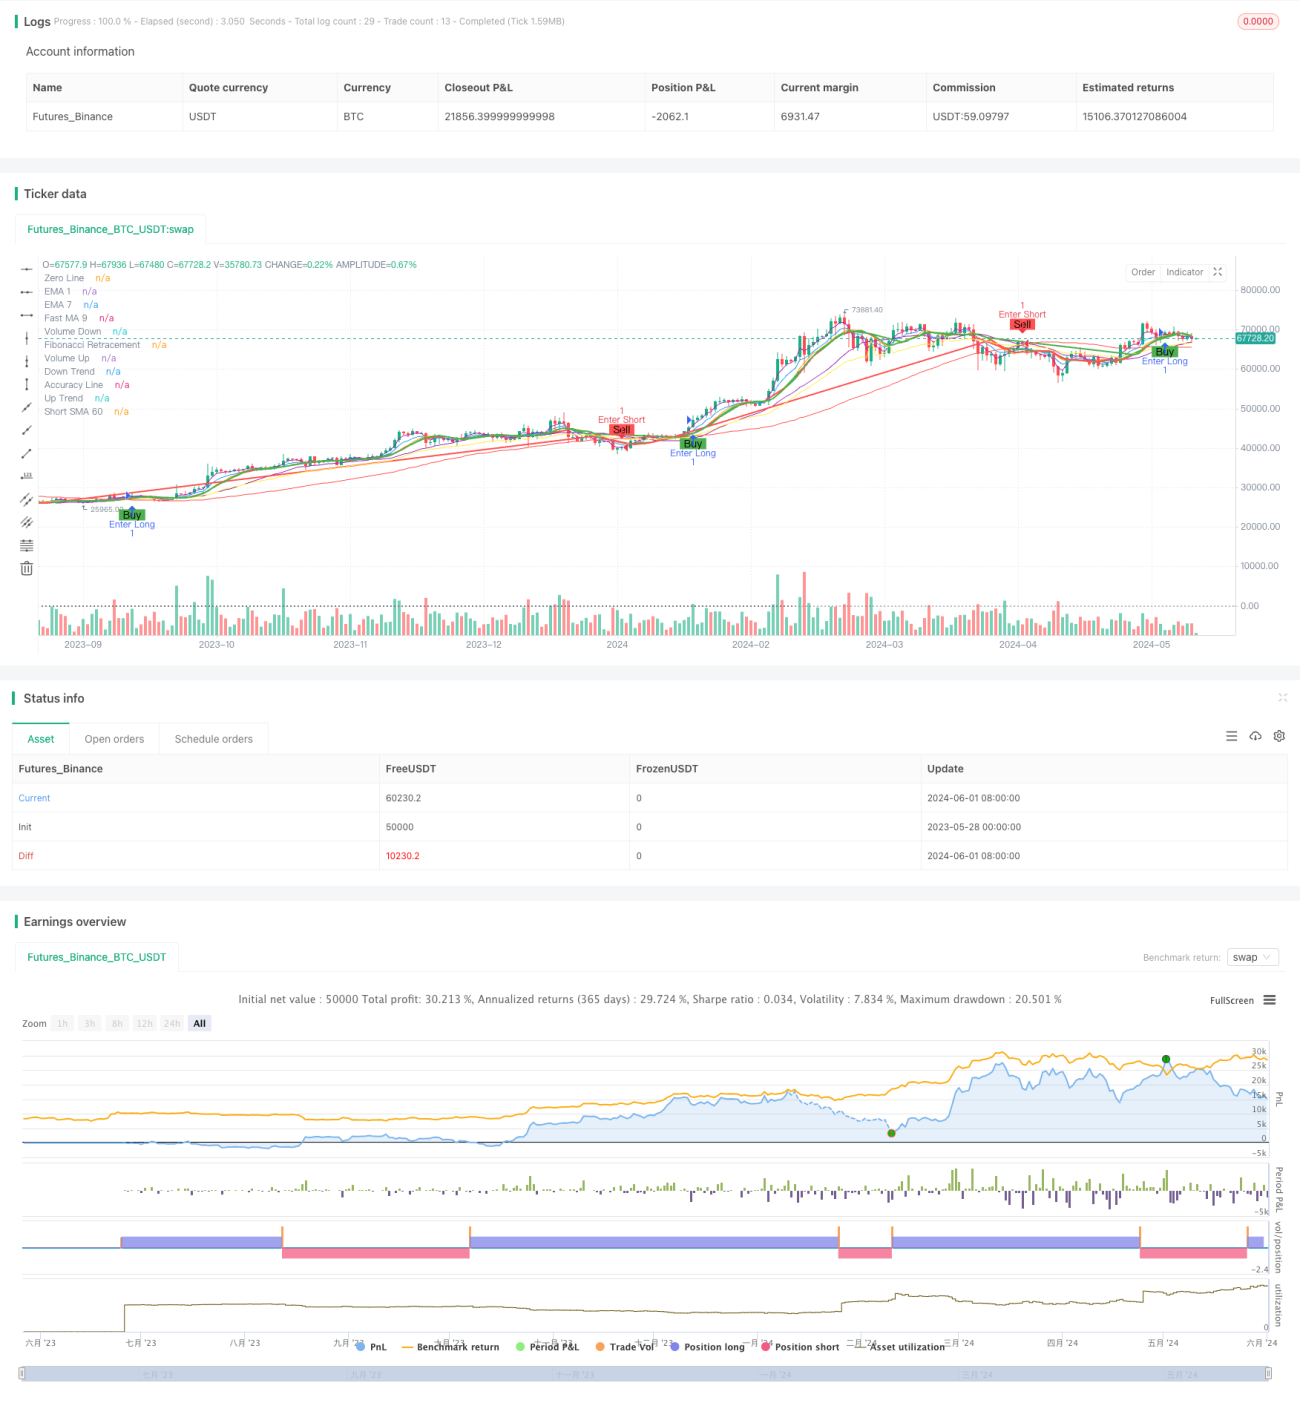
La stratégie utilise plusieurs moyennes mobiles (MA) comme indicateurs de tendance et de dynamisme, y compris les moyennes mobiles simples (SMA) et les moyennes mobiles indicielles (EMA). En outre, la stratégie utilise les moyennes mobiles de Fibonacci comme point d'entrée potentiel. L'objectif principal de la stratégie est de capturer des opportunités de vente et d'achat en temps opportun lorsque les prix et le volume des transactions évoluent de manière significative.
Principe de stratégie
- Les calculs de la MA rapide (par défaut 10) et de la MA lente (par défaut 30) indiquent une tendance à la hausse lorsque la MA rapide est supérieure à la MA lente, et à l'inverse une tendance à la baisse.
- Calculer le volume de transactions MA ((par défaut 20), le volume de transactions actuel est supérieur au volume de transactions MA indiquant une augmentation du volume de transactions, à l'inverse indiquant une diminution du volume de transactions.
- Utilisez plusieurs MA et EMA comme indicateurs auxiliaires, y compris les MA rapides (par défaut 9), les SMA à court terme (par défaut 10 et 60), et les EMA (par défaut 3 et 7).
- Les niveaux de rétractation de Fibonacci sont calculés comme des points de support et de résistance potentiels (en utilisant les valeurs 0,47, 0,658 et 0,886).
- Un signal d'achat ou de vente est généré lorsque le SMA court ((60)) se trouve à la croisée de la ligne de précision (basée sur la croisée des EMA rapides et des EMA lentes).
- Un signal de péréquation est généré lorsque la vitesse MA ((9)) est croisée avec celle de l'EMA ((7).
Analyse des avantages
- Les informations sur les prix et le volume des transactions sont combinées pour fournir une analyse plus complète du marché.
- L'utilisation de plusieurs MA et EMA comme indicateurs auxiliaires aide à confirmer les tendances et les changements de dynamique.
- Le niveau de rétractation de Fibonacci fournit une référence pour les points d'entrée potentiels et aide à optimiser le moment d'entrée.
- Les signaux d'achat et de vente sont basés sur le croisement des SMA à court terme et des lignes de précision, ce qui aide à saisir les points de retournement du marché en temps opportun.
- Les signaux de plafonnement sont basés sur un croisement des MA et des EMA rapides et aident à bloquer les gains ou les pertes en temps opportun.
Analyse des risques
- Dans un marché en crise, les signaux croisés fréquents peuvent entraîner des pertes de transactions et de frais excessifs.
- Les stratégies qui reposent sur les niveaux de MA et de Fibonacci calculés à partir des données historiques peuvent ne pas être en mesure de s'adapter à temps aux changements soudains du marché.
- La stratégie manque d'évaluation de la force d'une tendance du marché, ce qui peut générer de faux signaux lorsque la tendance est faible.
- Les paramètres de la stratégie (par exemple, le cycle MA) doivent être optimisés en fonction des différentes conditions du marché, sinon ils peuvent affecter l'efficacité de la stratégie.
Direction d'optimisation
- L'introduction d'indicateurs de la force de la tendance (comme l'ADX) et l'évitement de la négociation ou l'adoption de stratégies plus conservatrices lorsque la tendance est faible.
- Optimiser les paramètres cycliques de la MA et de l'EMA pour s'adapter à différentes conditions de marché et variétés de transactions.
- Le RSI, le MACD et d'autres indicateurs techniques sont utilisés pour améliorer la fiabilité du signal.
- Introduction de mécanismes de stop-loss et de stop-loss pour contrôler le seuil de risque pour les transactions individuelles.
- Pour les marchés en crise, envisagez d'adopter des stratégies de trading plus appropriées (comme le trading de portée).
Résumer
L'avantage de la stratégie réside dans la prise en compte intégrale de plusieurs facteurs du marché et l'utilisation de plusieurs MA et EMA comme indicateurs auxiliaires. Cependant, la stratégie peut générer des signaux de trading excessifs dans des marchés en turbulence et dépendre d'indicateurs calculés à partir de données historiques, ce qui nécessite une optimisation supplémentaire pour améliorer son adaptabilité et sa fiabilité. Les orientations d'optimisation comprennent l'introduction d'indicateurs de force de tendance, l'optimisation des paramètres, la combinaison d'autres indicateurs techniques et l'introduction de mesures de gestion des risques.
- 1