Stratégie de moyenne mobile basée sur le croisement de deux moyennes mobiles

Aperçu
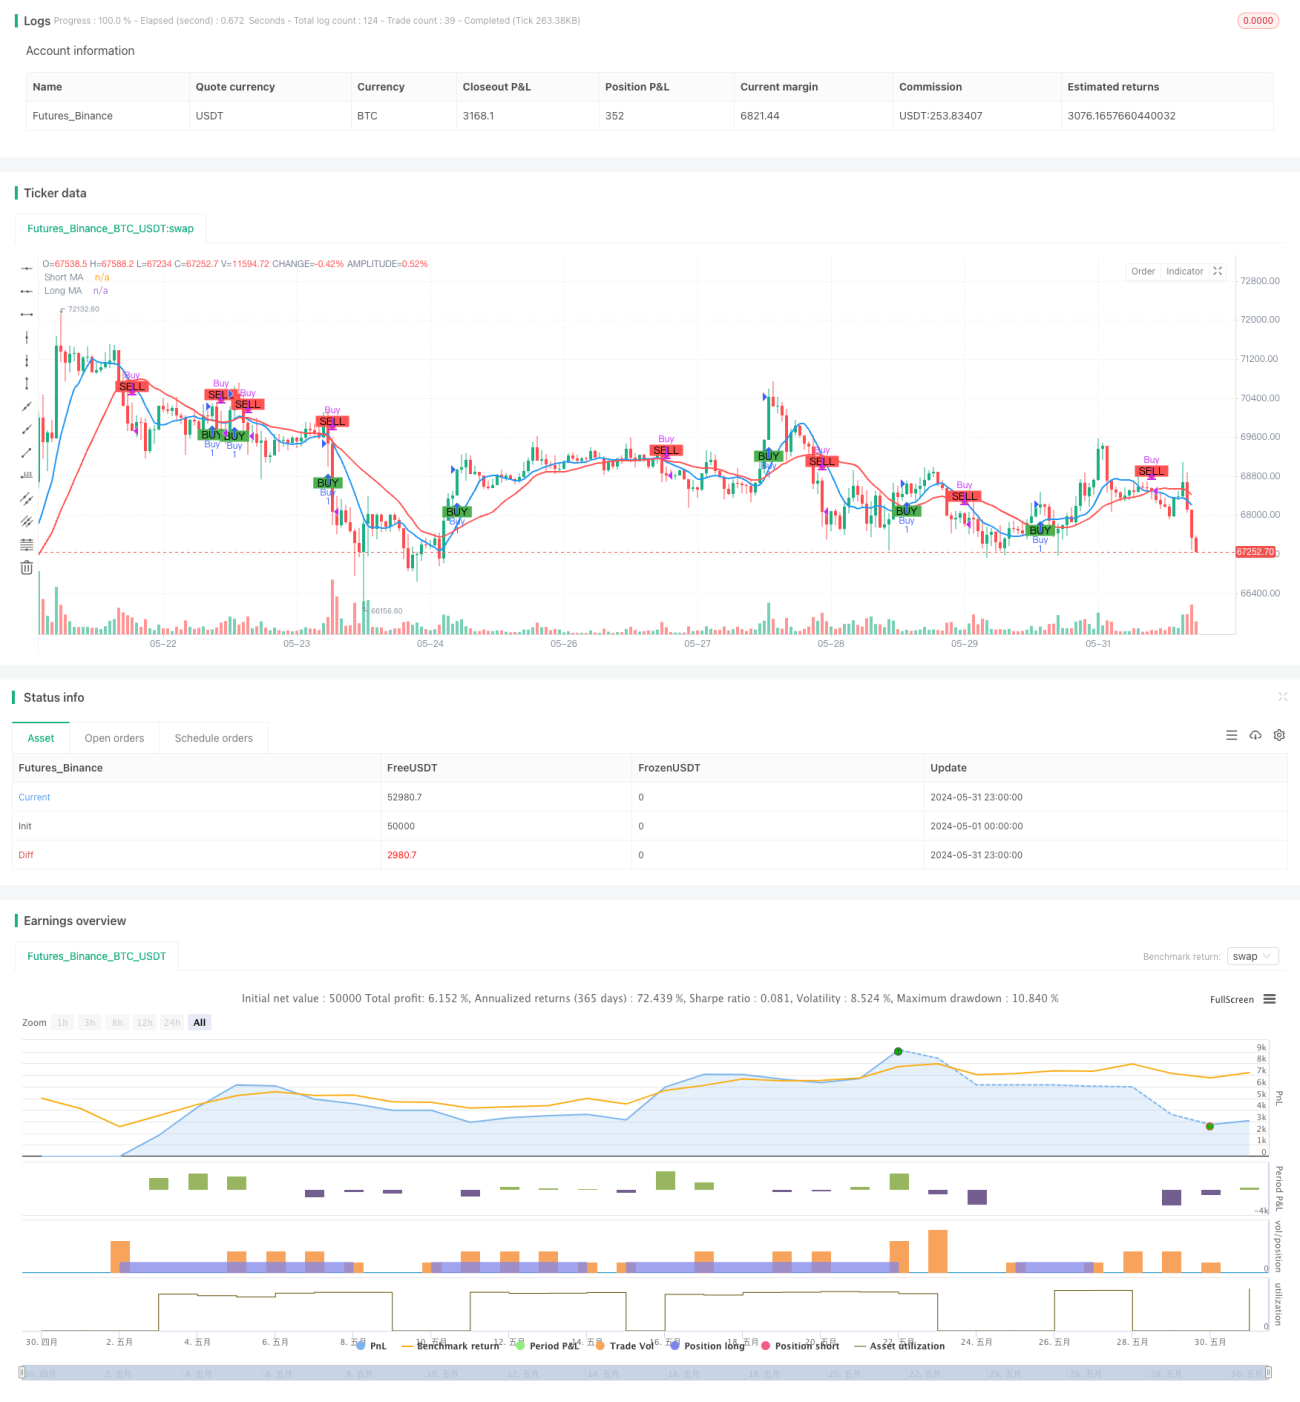
La stratégie des moyennes mobiles basées sur la croisée des deux moyennes est une méthode de négociation simple et efficace pour identifier les opportunités de vente et d'achat potentielles du marché en analysant la relation entre deux moyennes mobiles de différentes périodes. Elle utilise une moyenne mobile simple à court terme (SMA) et une moyenne mobile simple à long terme, qui indiquent un signal haussier et suggèrent une opportunité d'achat potentielle lorsque la moyenne moyenne à court terme traverse la moyenne moyenne à long terme.
Principe de stratégie
Le principe central de cette stratégie est d'utiliser les caractéristiques de tendance et de retard des moyennes mobiles de différentes périodes pour juger de la direction de la tendance actuelle du marché en comparant la moyenne courte et la moyenne longue afin de prendre des décisions de négociation correspondantes. Lorsque le marché est en hausse, le prix franchit la moyenne longue, puis la moyenne courte traverse la moyenne longue pour former un fourchette dorée, générant un signal d'achat. Lorsque le marché est en baisse, le prix tombe la moyenne longue, puis la moyenne courte traverse la moyenne longue pour former un fourchette morte et générer un signal de vente.
Avantages stratégiques
- Simple: La stratégie est basée sur la théorie classique des moyennes mobiles, sa logique est claire, facile à comprendre et à mettre en œuvre.
- Adaptabilité: La stratégie peut être appliquée à plusieurs marchés et à différentes variétés de transactions, et peut répondre de manière flexible à différentes caractéristiques du marché en ajustant les paramètres.
- Capture de tendance: la direction de la tendance est déterminée par le croisement de deux lignes égales, ce qui permet aux traders de suivre les tendances dominantes en temps opportun et d'améliorer leurs chances de profit.
- Contrôle des risques: La stratégie introduit le concept de gestion des risques, qui consiste à contrôler l'ouverture des risques de chaque transaction en ajustant les positions et en gérant efficacement les pertes potentielles.
- Réduction du bruit: Utilisez les caractéristiques de retard de la ligne moyenne pour filtrer efficacement le bruit aléatoire du marché et améliorer la fiabilité des signaux de négociation.
Risque stratégique
- Sélection de paramètres: les paramètres choisis peuvent avoir une influence importante sur la performance de la stratégie. Une mauvaise sélection peut entraîner l'échec ou une mauvaise performance de la stratégie.
- Tendances du marché: lorsque la stratégie risque de subir des pertes consécutives dans un marché en crise ou à un tournant de tendance
- Coûts de dérapage: la fréquence des transactions peut entraîner des coûts de dérapage plus élevés, affectant les bénéfices globaux de la stratégie.
- Les événements Black Swan: La stratégie est mal adaptée aux situations extrêmes, et les événements Black Swan peuvent entraîner des pertes importantes pour la stratégie.
- Risque de suradaptation: si l'optimisation des paramètres repose trop sur les données historiques, cela peut entraîner une mauvaise performance de la stratégie dans les transactions réelles.
Orientation de l'optimisation de la stratégie
- Optimisation des paramètres dynamiques: Adaptation dynamique des paramètres stratégiques en fonction des changements de l'état du marché, amélioration de l'adaptabilité.
- Confirmation de tendance: après la génération d'un signal de transaction, l'introduction d'autres indicateurs ou modèles de comportement des prix pour confirmer la tendance et améliorer la fiabilité du signal.
- Stop-loss: l'introduction d'un mécanisme de stop-loss raisonnable pour contrôler davantage le seuil de risque d'une seule transaction.
- Gestion des positions: méthodes d'optimisation des ajustements des positions, telles que l'introduction d'indicateurs de volatilité et l'ajustement dynamique des positions en fonction des niveaux de volatilité du marché.
- Évaluation de la force de pluralité: évaluation de la relation entre la force de pluralité et la force de vide, intervention au début de la tendance pour améliorer l'exactitude de la prise de tendance.
Résumer
La stratégie de moyenne mobile basée sur le croisement de deux courbes est une méthode de négociation simple et pratique, permettant de déterminer la direction de la tendance du marché en comparant la position des différentes courbes périodiques pour générer un signal de négociation. La logique de la stratégie est claire et adaptable. Elle permet de capturer efficacement la tendance du marché, tout en introduisant des mesures de gestion des risques pour contrôler les pertes potentielles.
Overview
The Moving Average Crossover Strategy based on dual moving averages is a straightforward and effective intraday trading approach designed to identify potential buy and sell opportunities in the market by analyzing the relationship between two moving averages of different periods. This strategy utilizes a short-term simple moving average (SMA) and a long-term simple moving average. When the short-term moving average crosses above the long-term moving average, it indicates a bullish signal, suggesting a potential buying opportunity. Conversely, when the short-term moving average crosses below the long-term moving average, it indicates a bearish signal, suggesting a potential selling opportunity. This crossover method helps traders capture trending moves in the market while minimizing market noise interference.
Strategy Principle
The core principle of this strategy is to utilize the trend characteristics and lag of moving averages with different periods. By comparing the relative position relationship between the short-term moving average and the long-term moving average, it determines the current market trend direction and makes corresponding trading decisions. When an upward trend emerges in the market, the price will first break through the long-term moving average, and the short-term moving average will subsequently cross above the long-term moving average, forming a golden cross and generating a buy signal. When a downward trend emerges in the market, the price will first break below the long-term moving average, and the short-term moving average will subsequently cross below the long-term moving average, forming a death cross and generating a sell signal. In the parameter settings of this strategy, the period of the short-term moving average is set to 9, and the period of the long-term moving average is set to 21. These two parameters can be adjusted based on market characteristics and personal preferences. Additionally, this strategy introduces the concept of money management by setting the initial capital and risk percentage per trade, using position sizing to control the risk exposure of each trade.
Strategy Advantages
- Simplicity: This strategy is based on the classic moving average theory, with clear logic and easy to understand and implement.
- Adaptability: This strategy can be applied to multiple markets and different trading instruments. By adjusting parameter settings, it can flexibly adapt to different market characteristics.
- Trend Capture: By using the dual moving average crossover to determine the trend direction, it helps traders timely follow the mainstream trend and increase profit opportunities.
- Risk Control: This strategy introduces the concept of risk management, using position sizing to control the risk exposure of each trade, effectively managing potential losses.
- Noise Reduction: By utilizing the lag characteristic of moving averages, it effectively filters out random noise in the market, improving the reliability of trading signals.
Strategy Risks
- Parameter Selection: Different parameter settings can have a significant impact on strategy performance. Improper selection may lead to strategy failure or poor performance.
- Market Trend: In ranging markets or trend turning points, this strategy may experience consecutive losses.
- Slippage Costs: Frequent trading may result in higher slippage costs, affecting the overall profitability of the strategy.
- Black Swan Events: This strategy has poor adaptability to extreme market conditions, and black swan events may cause significant losses to the strategy.
- Overfitting Risk: If parameter optimization relies too heavily on historical data, it may lead to poor performance of the strategy in actual trading.
Strategy Optimization Directions
- Dynamic Parameter Optimization: Dynamically adjust strategy parameters based on changes in market conditions to improve adaptability.
- Trend Confirmation: After generating trading signals, introduce other indicators or price behavior patterns to confirm the trend, improving signal reliability.
- Stop-Loss and Take-Profit: Introduce reasonable stop-loss and take-profit mechanisms to further control the risk exposure of each trade.
- Position Management: Optimize the position sizing method, such as introducing volatility indicators to dynamically adjust positions based on market volatility levels.
- Long-Short Strength Assessment: Assess the comparative relationship between bullish and bearish strengths, entering at the early stage of a trend to improve the accuracy of trend capture.
Summary
The Moving Average Crossover Strategy based on dual moving averages is a simple and practical intraday trading method. By comparing the position relationship of moving averages with different periods, it determines the market trend direction and generates trading signals. This strategy has clear logic, strong adaptability, and can effectively capture market trends while introducing risk management measures to control potential losses. However, this strategy also has potential risks such as parameter selection, trend reversal, frequent trading, etc. It needs to be further improved through dynamic optimization, signal confirmation, position management, and other methods to enhance the robustness and profitability of the strategy. In general, as a classic technical analysis indicator, the basic principles and practical application value of moving averages have been widely verified by the market. It is a trading strategy worthy of in-depth research and continuous optimization.
- 1