Stratégie combinée Supertrend et EMA

Aperçu
Une stratégie de négociation combinant l'indicateur Supertrend et plusieurs EMA. Cette stratégie utilise l'indicateur Supertrend pour déterminer la direction de la tendance du marché actuel, tout en utilisant des EMA de différentes périodes comme condition de déclenchement d'un signal d'achat et de vente. Un signal d'achat est généré lorsque l'EMA à court terme se confond avec l'EMA intermédiaire et que l'indicateur Supertrend montre une tendance à la hausse.
Principe de stratégie
Le principe central de la combinaison de la stratégie de Supertrend et EMA est d'utiliser les caractéristiques de l'indicateur de Supertrend et de l'indicateur d'EMA pour capturer les changements de tendance et les fluctuations des prix sur le marché. L'indicateur de Supertrend détermine la direction de la tendance du marché en comparant le cours de clôture actuel avec la trajectoire ascendante et descendante du cycle précédent.
Avantages stratégiques
- Les indicateurs Supertrend permettent de capturer efficacement les changements de tendances du marché et aident les stratégies à suivre les tendances du marché.
- Confirmation de l'EMA multiple: l'utilisation d'indicateurs EMA de différentes périodes comme conditions de déclenchement des signaux d'achat et de vente peut améliorer la fiabilité des signaux et réduire l'apparition de faux signaux.
- Contrôle des risques: les indices de tendance de Supertrend permettent d'éviter les transactions dans des conditions défavorables et de réduire les risques.
- Adaptabilité: La stratégie peut être appliquée à différents marchés et variétés, avec une meilleure adaptabilité et flexibilité.
Risque stratégique
- Risque d'optimisation des paramètres: les paramètres de l'indicateur Supertrend et de l'indicateur EMA ont un impact significatif sur la performance de la stratégie. Des paramètres inappropriés peuvent entraîner l'échec de la stratégie.
- Risque de fluctuation du marché: lors de fortes fluctuations du marché, des croisements fréquents entre les EMA à court terme et les EMA à moyen terme peuvent survenir, ce qui entraîne plusieurs faux signaux pour la stratégie.
- Risque de renversement de tendance: lorsque la tendance du marché est renversée, l'indicateur Supertrend peut être en retard, ce qui entraîne des pertes de stratégie au début de la tendance.
Orientation de l'optimisation de la stratégie
- Optimisation des paramètres: la stabilité et la rentabilité de la stratégie sont améliorées en trouvant la combinaison optimale de paramètres en optimisant les multiples de l'indicateur Supertrend et les cycles de l'indicateur EMA.
- Filtrage du signal: après la génération d'un signal croisé EMA, le signal peut être confirmé une deuxième fois en combinaison avec d'autres indicateurs techniques (tels que RSI, MACD, etc.), ce qui améliore la fiabilité du signal.
- Stop-loss: introduire des mécanismes de stop-loss raisonnables, contrôler le risque d'une seule transaction et améliorer le rapport risque/bénéfice de la stratégie.
- Variétés multiples et cycles multiples: appliquer la stratégie à différentes variétés et cycles pour réduire le risque global en diversifiant les investissements.
Résumer
La stratégie de combinaison de Supertrend et d'EMA forme un système de trading complet de suivi de la tendance en combinant l'indicateur Supertrend avec plusieurs indicateurs EMA. Cette stratégie utilise l'indicateur Supertrend pour juger de la tendance du marché, tout en générant des signaux d'achat et de vente grâce à la croisée des indicateurs EMA.
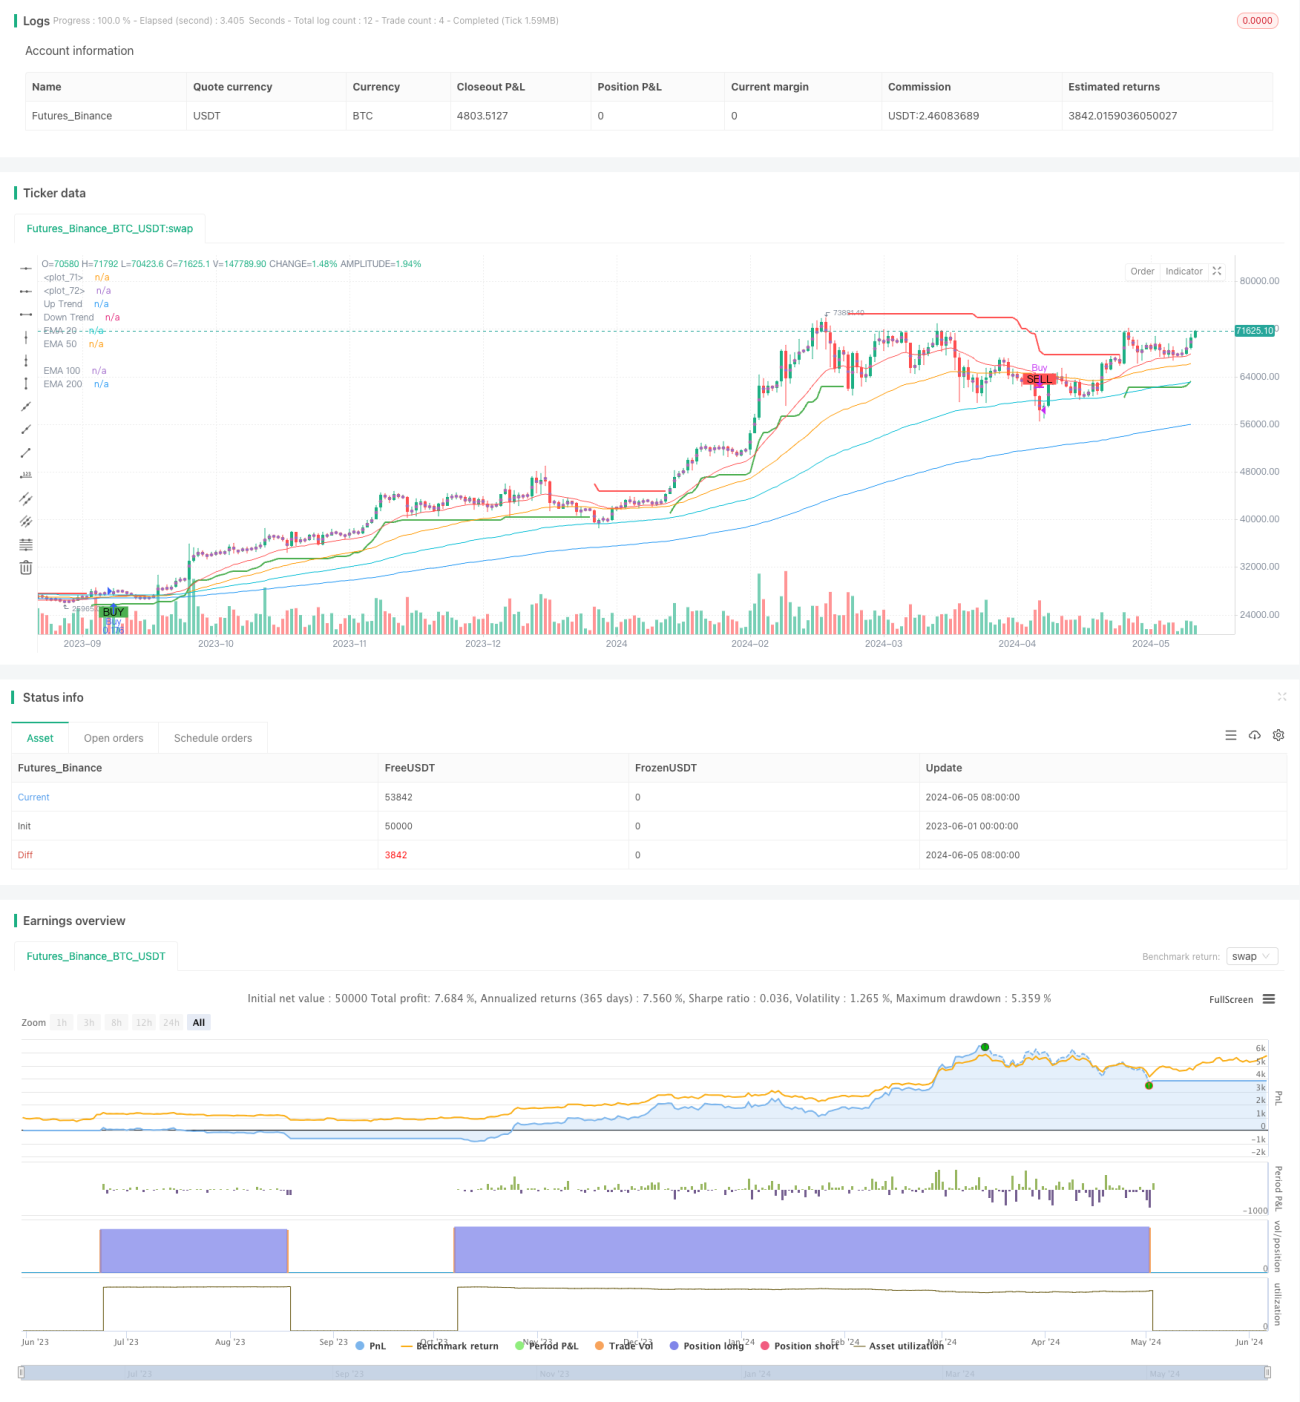
/*backtest
start: 2023-06-01 00:00:00
end: 2024-06-06 00:00:00
period: 1d
basePeriod: 1h
exchanges: [{"eid":"Futures_Binance","currency":"BTC_USDT"}]
*/

//@version=4
strategy("Supertrend EMA Strategy", overlay=true, default_qty_type=strategy.percent_of_equity, default_qty_value=10)

// Supertrend Parameters- 1