Stratégie de tendance RSI

Aperçu
La stratégie est basée sur l'indicateur de force relative (RSI) pour déterminer les signaux d'achat et de vente en jugeant si la valeur de l'indicateur RSI est supérieure ou inférieure à la valeur de basculement prédéfinie. La stratégie définit également des limites de temps de stop-loss et de tenue de position pour contrôler les risques.
Principe de stratégie
- Calculer le RSI
- Un signal d'achat est généré lorsque le RSI est inférieur au seuil de vente par défaut; un signal de vente est généré lorsque le RSI est supérieur au seuil de vente par défaut.
- Selon le signal d'achat, le nombre d'achats est calculé sur la base du prix de clôture actuel et les commandes sont achetées.
- Si le ratio de stop-loss est défini, le prix de stop-loss est calculé et le stop-loss est placé.
- La position de tous les détenteurs d'une position de placement est levée en fonction du signal de vente ou de la condition de stop-loss.
- Si le temps de détention maximal est défini, tous les détenteurs de positions sont liquidés après que le temps de détention dépasse le temps de détention maximal, quel que soit le gain ou la perte.
Avantages stratégiques
- L'indicateur RSI est un indicateur d'analyse technique largement utilisé pour capturer efficacement les signaux de survente et de survente du marché.
- La stratégie introduit des limites de stop loss et de tenue de position pour aider à contrôler les risques.
- La logique de la stratégie est claire, facile à comprendre et à mettre en œuvre.
- Il est possible de s'adapter à différentes conditions de marché en ajustant les paramètres et les seuils du RSI.
Risque stratégique
- L'indicateur RSI peut émettre des signaux erronés dans certains cas, ce qui entraîne des pertes pour la stratégie.
- La stratégie ne prend pas en compte les facteurs fondamentaux des variétés négociées et repose uniquement sur des indicateurs techniques, qui peuvent présenter un risque d'événements inattendus sur le marché.
- Le taux de stop-loss fixe peut ne pas s'adapter à la volatilité du marché.
- La performance d'une stratégie peut être influencée par les paramètres, et des paramètres inappropriés peuvent entraîner une mauvaise performance de la stratégie.
Orientation de l'optimisation de la stratégie
- L'introduction d'autres indicateurs techniques tels que les moyennes mobiles améliore la fiabilité de la stratégie.
- Optimiser les stratégies de stop loss, par exemple en utilisant des stop loss mobiles ou des stop loss dynamiques basés sur la volatilité.
- Les paramètres et les seuils du RSI sont ajustés en fonction de la dynamique du marché.
- Combiner l'analyse des fondamentaux de la variété des transactions pour améliorer la capacité de contrôle des risques de la stratégie.
- Les stratégies sont testées et optimisées pour trouver la meilleure combinaison de paramètres.
Résumer
La stratégie utilise l'indicateur RSI pour capturer les signaux de surachat et de survente du marché, tout en introduisant des limites de stop-loss et de temps de tenue pour contrôler les risques. La logique de la stratégie est simple, facile à mettre en œuvre et à optimiser. Cependant, la performance de la stratégie peut être affectée par les fluctuations du marché et les paramètres de réglage, ce qui nécessite une combinaison d'autres méthodes d'analyse et de gestion des risques pour améliorer la solidité et la rentabilité de la stratégie.
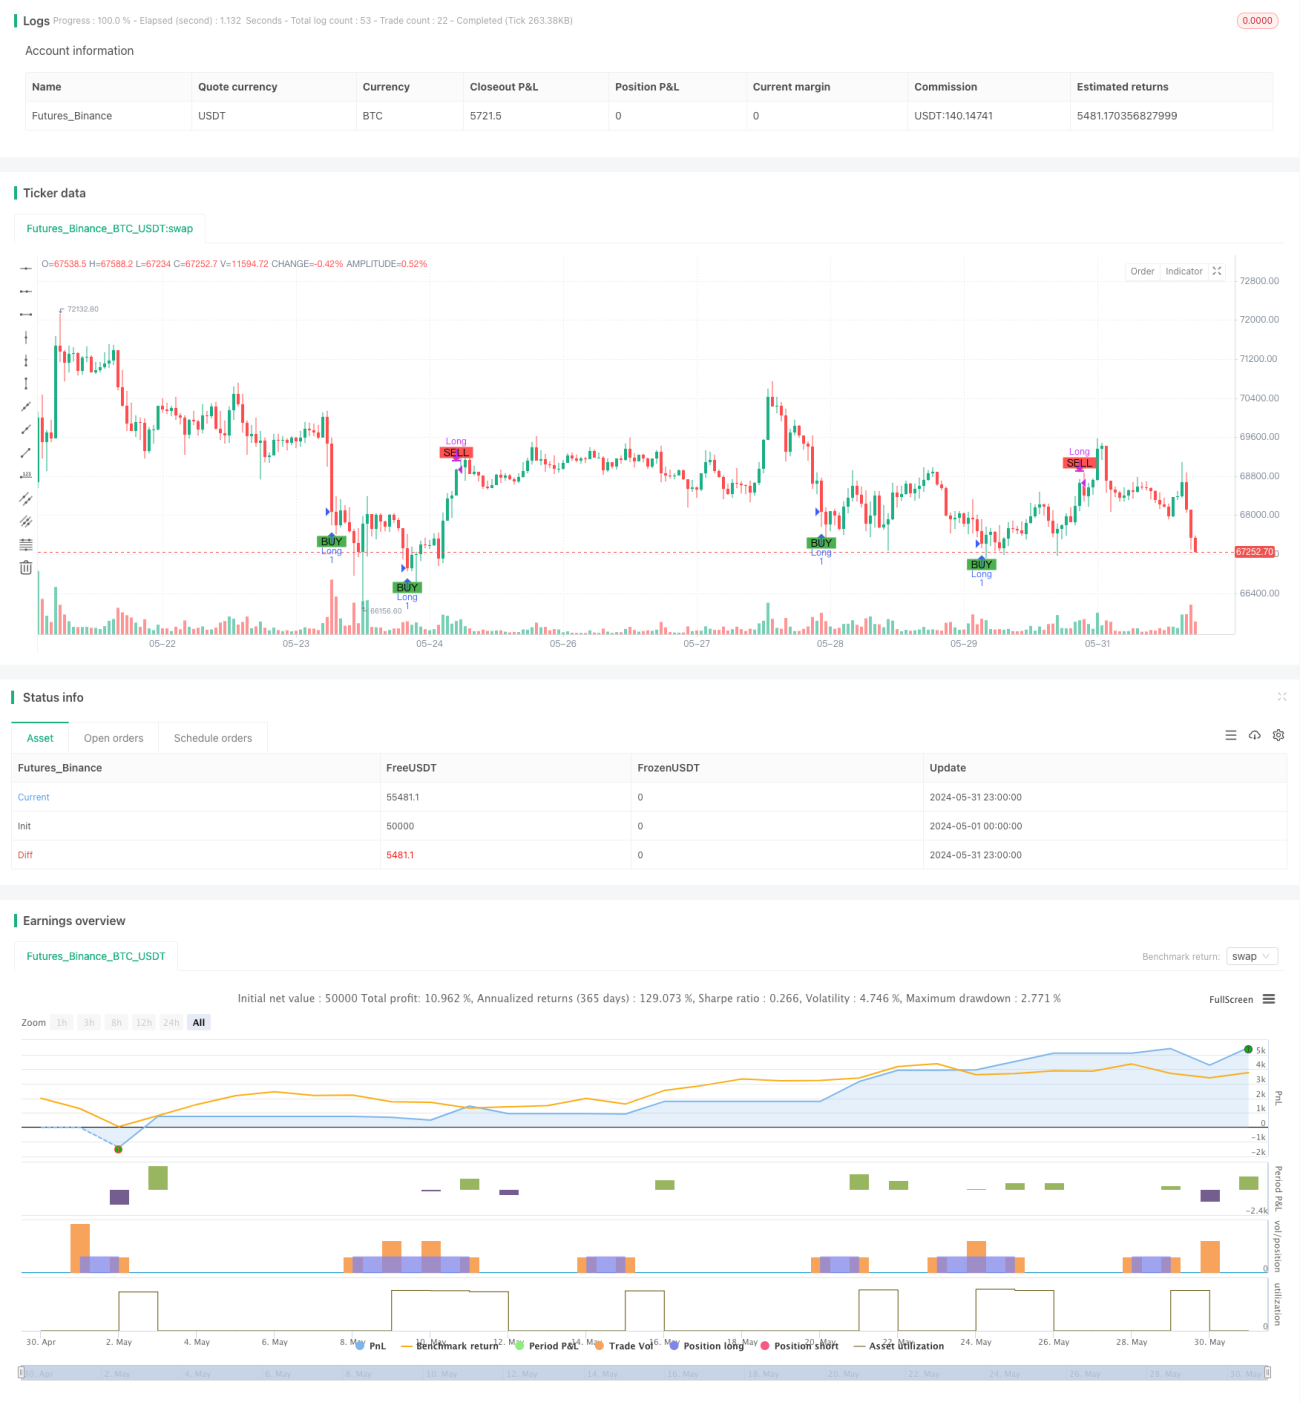
/*backtest
start: 2024-05-01 00:00:00
end: 2024-05-31 23:59:59
period: 1h
basePeriod: 15m
exchanges: [{"eid":"Futures_Binance","currency":"BTC_USDT"}]
*/

//@version=5
strategy("Simple RSI Strategy", overlay=true,  initial_capital=20, commission_value=0.1, commission_type=strategy.commission.percent)

// Define the hardcoded date (Year, Month, Day, Hour, Minute)- 1