Stratégie de trading quantitative des bénéfices non réalisés relatifs EMA100 et NUPL

Aperçu
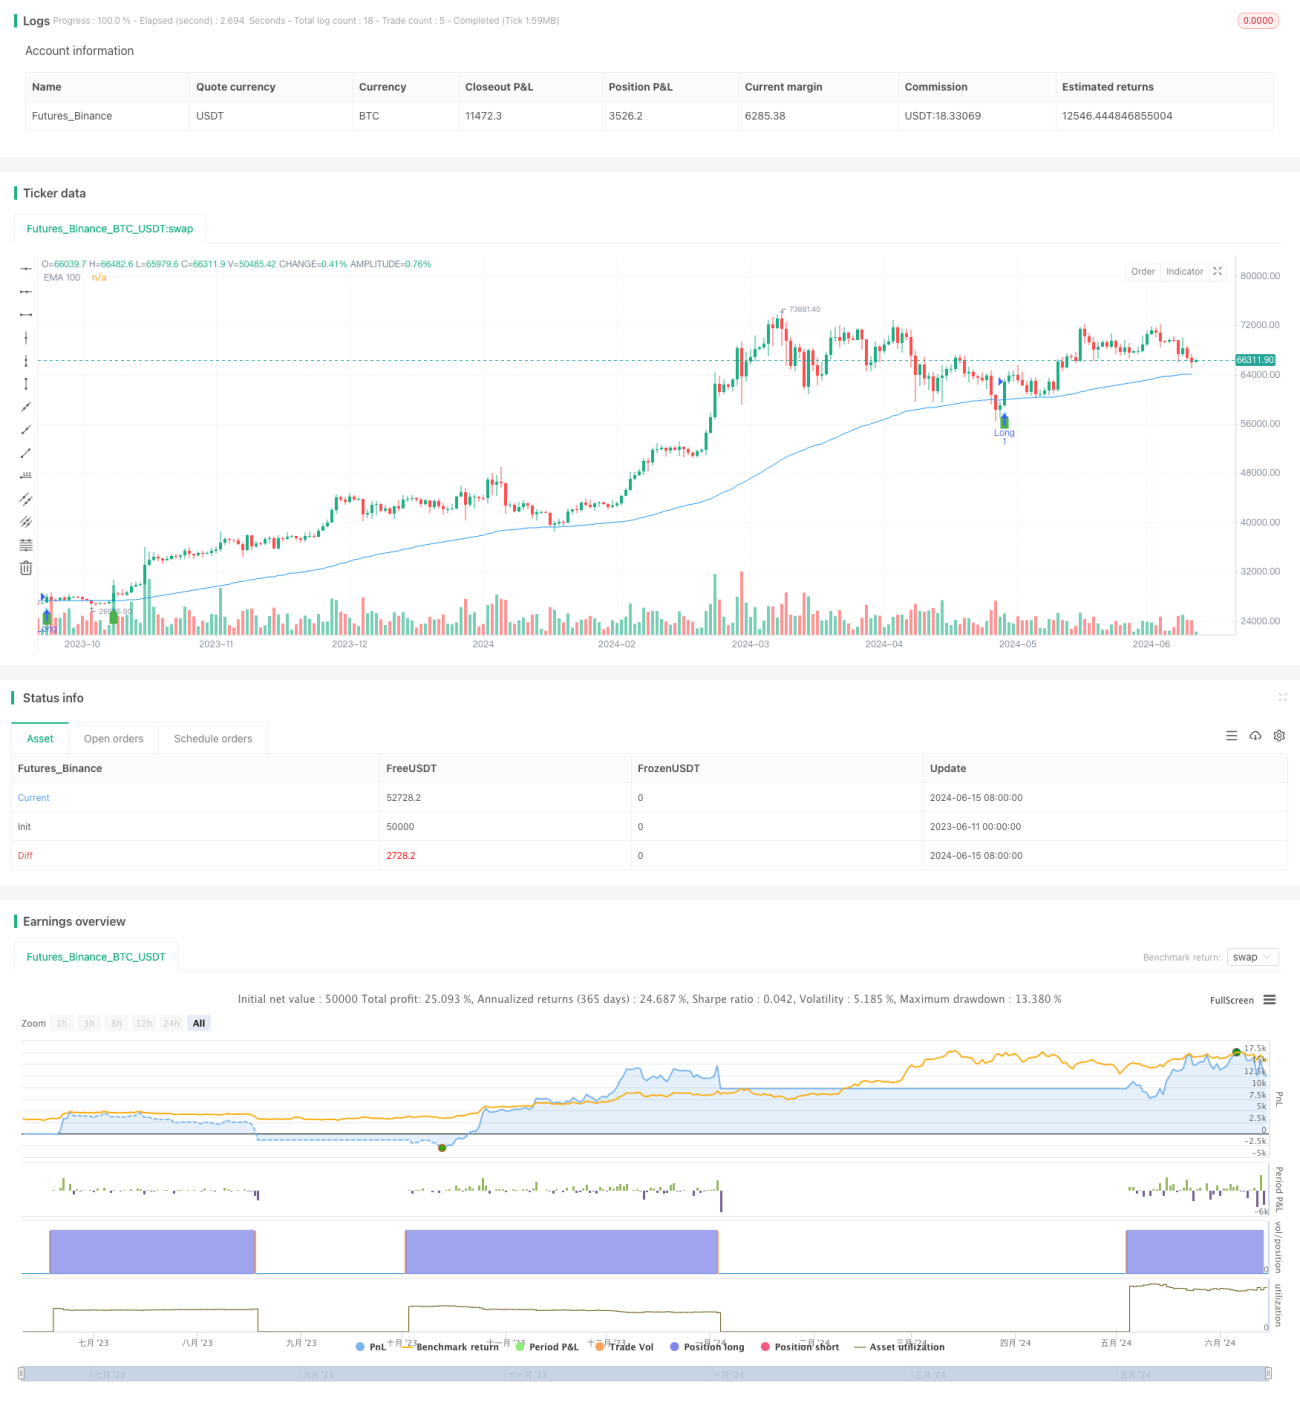
La stratégie de négociation est basée sur la moyenne mobile de l'indice à 100 cycles (EMA100), les bénéfices/pertes nets non réalisés (NUPL) et les trois indicateurs de bénéfices relativement non réalisés, pour générer un signal de négociation en jugeant le croisement du prix avec l'EMA100 et le négatif du NUPL et des bénéfices relativement non réalisés. Un signal de multiplication est déclenché lorsque le prix atteint l'EMA100 et que le NUPL et le bénéfice relativement non réalisé sont positifs; un signal de vide est déclenché lorsque le prix atteint l'EMA100 et que le NUPL et le bénéfice relativement non réalisé sont négatifs.
Principe de stratégie
- Calcul des EMA à 100 cycles comme indicateur principal de tendance
- Utilisation de la NUPL et du bénéfice relatif non réalisé comme indicateurs auxiliaires pour confirmer la force et la durabilité de la tendance
- Le NUPL et le profit relativement inexploité génèrent simultanément des signaux de plus/de moins pour les heures positives/négatives au moment où le prix franchit/dépasse l'EMA100
- Utilisez une position fixe de 10% et un arrêt de 10% pour contrôler le risque
- Lorsqu'il détient une position en plus, il annule la position en plus si le prix dépasse le prix de rupture; lorsqu'il détient une position en moins, il annule la position en moins si le prix dépasse le prix de rupture
Analyse des avantages
- Simple et compréhensible: la logique de la stratégie est claire, les indicateurs techniques courants sont utilisés, elle est facile à comprendre et à mettre en œuvre
- Suivi des tendances: capture des tendances majeures à l'aide de l'EMA100, adaptée à une utilisation sur un marché tendance
- Contrôle des risques: définir des positions fixes et des arrêts pour contrôler efficacement les risques
- Adaptabilité: la stratégie peut être appliquée à différents marchés et indices
Analyse des risques
- Faux signaux: dans un marché en turbulence, des croisements fréquents avec l'EMA100 peuvent générer plus de faux signaux, entraînant des pertes
- L'EMA, en tant qu'indicateur de retard, peut être lent à réagir lors d'un renversement de tendance et manquer le meilleur moment d'entrée
- Optimisation des paramètres: les paramètres de la stratégie (tels que le cycle EMA, la taille de la position, le taux de rupture) doivent être optimisés en fonction des différents marchés. Des paramètres inappropriés peuvent entraîner une mauvaise efficacité de la stratégie.
Direction d'optimisation
- Optimisation des paramètres: optimisation des paramètres tels que le cycle EMA, la taille de la position et le taux de rupture pour améliorer la performance de la stratégie
- Filtrage des signaux: ajout d'autres indicateurs techniques ou d'émotions du marché pour filtrer les faux signaux
- Gestion dynamique des positions: modification dynamique des positions en fonction de facteurs tels que la volatilité du marché, les gains et les pertes des comptes, pour améliorer les rendements et contrôler les risques
- Portefeuille multi-volets: position à plusieurs et à zéro, couverture contre le risque de marché, amélioration de la stabilité stratégique
Résumer
La stratégie de négociation génère des signaux de négociation grâce à l'EMA100, le NUPL et trois indicateurs de rentabilité relativement inatteignable. Elle présente des avantages tels que la clarté logique, la maîtrise des risques et une forte adaptabilité. Il existe également des risques tels que les faux signaux, la retardation et l'optimisation des paramètres.
- 1