Stratégie de retournement bas du RSI

Aperçu
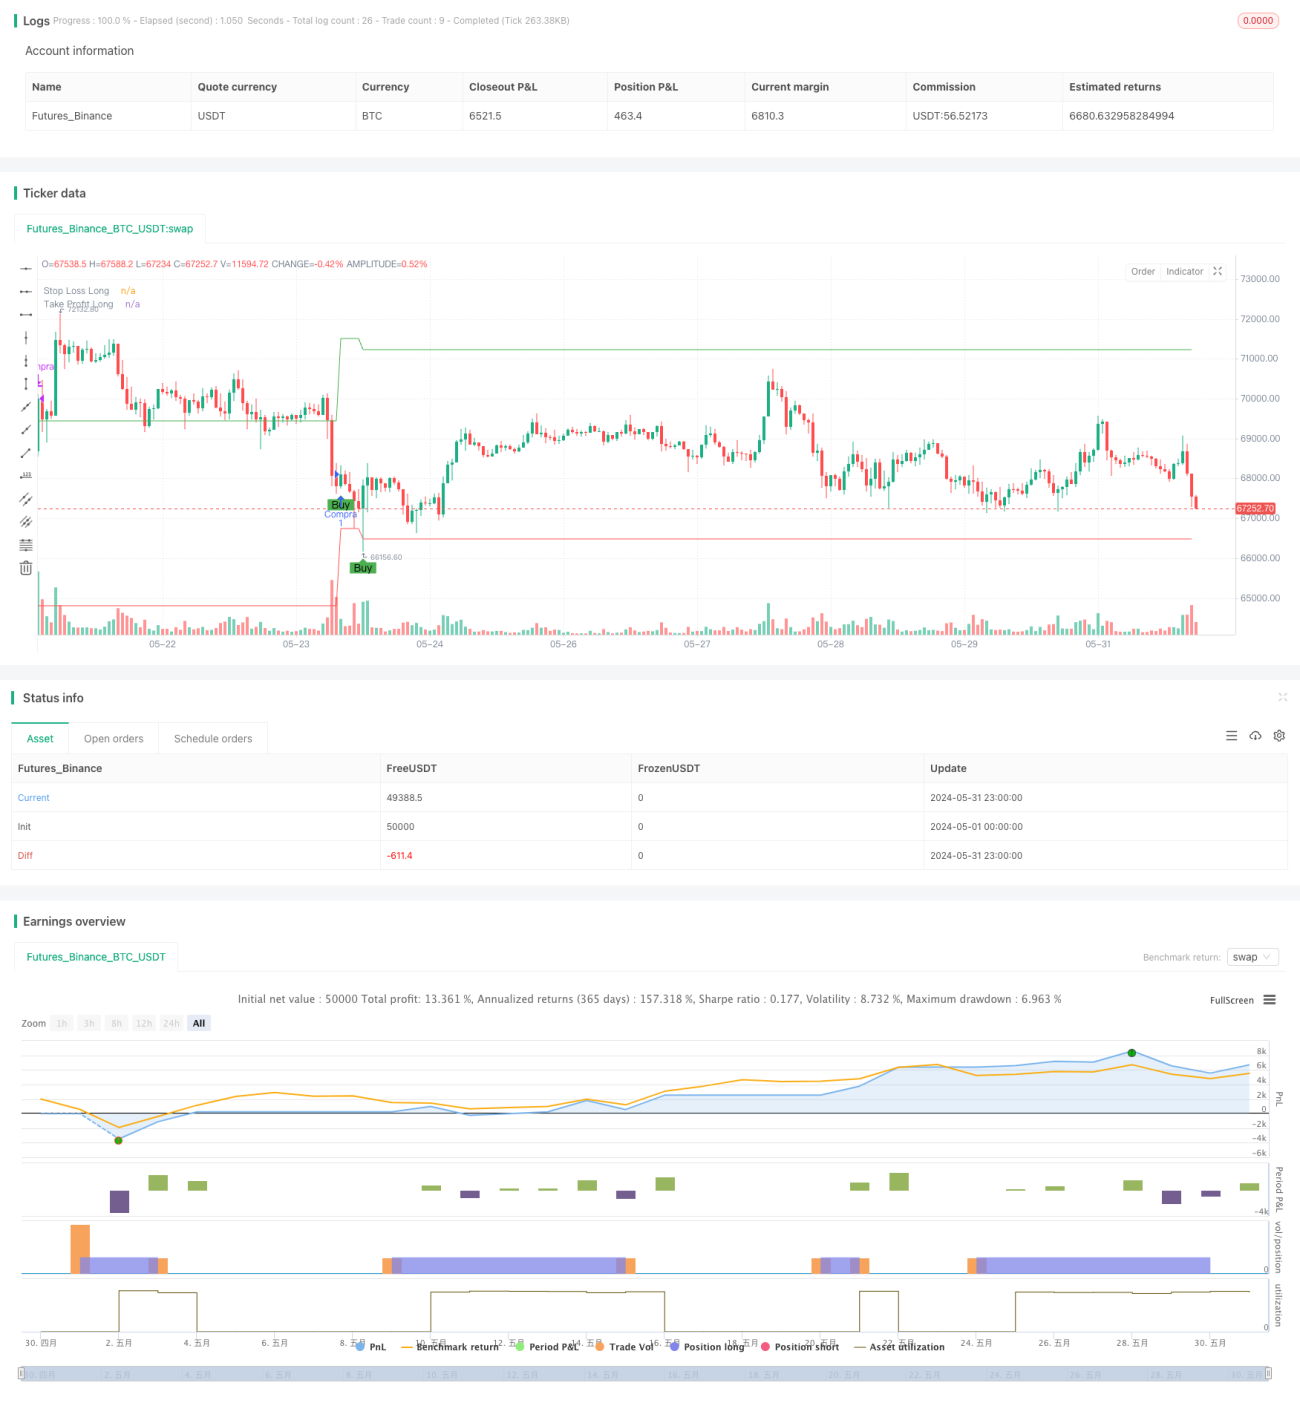
La stratégie utilise l'indice de force relative (RSI) pour juger de la survente du marché, générant un signal d'achat lorsque le RSI est inférieur au seuil de survente défini, tout en définissant un stop loss (stop loss) et un stop loss (take profit) pour contrôler le risque et verrouiller les bénéfices. La stratégie fait plus, pas moins.
Principe de stratégie
- Calculer l'indicateur RSI pour mesurer le sur-achat et le sur-vente du marché.
- Un signal d'achat est généré lorsque le RSI est inférieur au seuil de survente défini (défaut de 30).
- Après l'achat, le prix de l'arrêt de perte et le prix d'arrêt sont calculés en fonction du prix de clôture actuel et du pourcentage de stop-loss défini.
- Lorsqu'une position est détenue, si le prix atteint le prix d'arrêt, le placement est arrêté; si le prix atteint le prix d'arrêt, le placement est arrêté.
- Pendant la tenue d'une position, aucun nouveau signal d'achat ne sera généré jusqu'à ce que la position actuelle soit à plat.
Avantages stratégiques
- Simple et facile à utiliser: La stratégie est logiquement claire, ne nécessite que quelques paramètres et convient aux débutants.
- Le suivi des tendances: les indicateurs RSI permettent de juger si une tendance est en survente et d'intervenir plus tôt dans la tendance pour saisir les opportunités potentielles de renversement.
- Contrôle du risque: avec le stop loss et le stop stop, le seuil de risque d'une transaction unique peut être contrôlé efficacement, tout en étant capable de bloquer les profits déjà réalisés.
Risque stratégique
- Optimisation des paramètres: la performance de la stratégie dépend de la sélection de paramètres tels que la périodicité du RSI et les seuils de survente, et différents paramètres peuvent donner des résultats différents.
- Risque de marché: Le RSI peut rester dans la zone de survente pendant une longue période lorsque le marché est en baisse, ce qui entraîne de fréquents faux signaux.
- Risque de tendance: la stratégie fonctionne bien dans les marchés en tremblement de terre, mais peut manquer une partie des bénéfices en raison du manque de capacité de suivi des tendances dans les marchés en forte tendance.
Orientation de l'optimisation de la stratégie
- Ajout de filtres de tendance: avant de générer un signal d'achat, il est nécessaire de déterminer si la tendance actuelle est à la hausse, en utilisant des moyennes mobiles ou d'autres indicateurs de tendance.
- Optimisation des stop-loss: on peut envisager d'utiliser des stop-loss mobiles ou des stop-loss dynamiques, qui ajustent automatiquement la position des stop-loss avec les variations de prix, afin de rechercher un plus haut rapport bénéfice-risque.
- Combinaison avec d'autres indicateurs: il peut être envisagé d'utiliser le RSI en combinaison avec d'autres indicateurs (comme le MACD, les bandes de Brin, etc.) pour améliorer la fiabilité et la précision du signal.
Résumer
La stratégie utilise l'indicateur RSI pour capturer les opportunités de reprise de la survente du marché, tout en définissant des arrêts de perte fixes pour contrôler les risques. La logique de la stratégie est simple et claire et convient aux débutants. Cependant, la stratégie présente également certaines limites, telles que la faible capacité de saisie de la tendance, la fiabilité du signal à améliorer, etc.
- 1