Stratégie de croisement de moyennes mobiles haussières EMA

1
Follow
1781
Followers
Aperçu
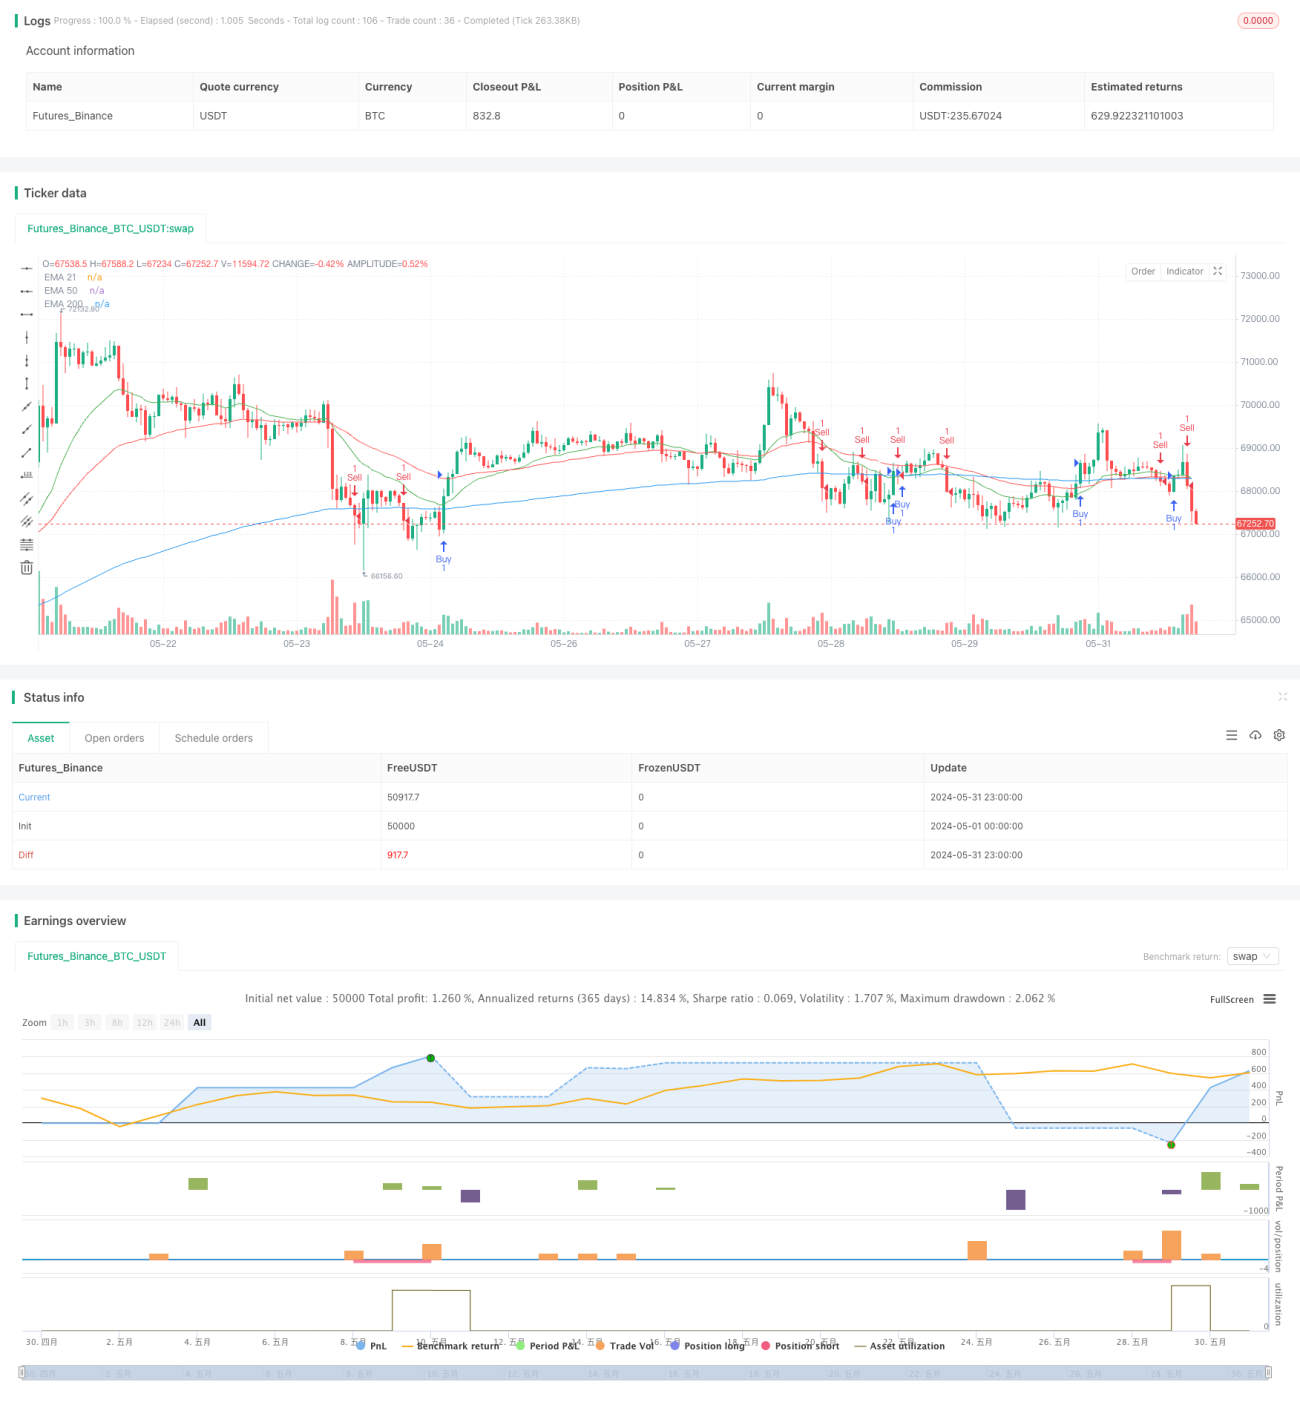
La stratégie utilise une moyenne mobile indicielle (EMA) et un indice de relative faiblesse (RSI) de trois périodes différentes pour juger de la tendance du marché et des signaux de négociation. Elle génère un signal d'achat lorsque le prix franchit l'EMA de 200 jours et que le RSI est supérieur à 50, et un signal de vente lorsque le prix tombe sous l'EMA de 200 jours et que le RSI est inférieur à 50.
Principe de stratégie
- Les lignes bleues, rouges et vertes indiquent les EMA de 200, 50 et 21 jours.
- Calculer le RSI à 14 cycles.
- Un signal d'achat est généré lorsque le cours de clôture traverse l'EMA de 200 jours et que le RSI est supérieur à 50.
- Un signal de vente est généré lorsque le cours de clôture franchit l'EMA de 200 jours et que le RSI est inférieur à 50.
- La taille de la position est de 1% du montant net du compte.
- Le stop loss de l'opération d'achat est de 50 points au-dessous de l'EMA de 200 jours, et le stop stop est de 100 points au-dessus du prix d'achat.
- Le stop loss de la vente est de 50 points au-dessus de l'EMA à 200 jours et le stop loss de 100 points au-dessous du prix de vente.
Avantages stratégiques
- La combinaison des prix et des indicateurs de dynamique aide à saisir le moment où une tendance se forme et s'inverse.
- Trois EMA de différentes périodes peuvent refléter pleinement les tendances à court, moyen et long terme, réduisant la fréquence des signaux et les faux signaux.
- Le RSI permet de filtrer les signaux de trading dans les marchés instables et de réduire les pertes.
- Le taux de placement est fixe, ce qui permet de contrôler le risque.
- Il est possible de mettre en place un Stop Loss Barrier pour éviter les risques de transaction unique.
Risque stratégique
- Le retard dans la signalisation d'un tournant de tendance peut entraîner une perte partielle de bénéfices.
- Le signal RSI peut générer des signaux de revers prématurément dans une tendance forte.
- Les positions en pourcentage fixe sont plus risquées en cas de forte volatilité.
- Les arrêts trop proches de la moyenne des 200 jours peuvent entraîner des arrêts fréquents.
Orientation de l'optimisation de la stratégie
- L'introduction d'autres combinaisons de ligne moyenne à moyen et long terme pour optimiser le signal.
- Le RSI doit être ajusté en tenant compte de la déviation et de la sur-achat/sur-vente.
- La taille de la position est ajustée dynamiquement en fonction des indicateurs de volatilité tels que ATR.
- Optimiser la position de l'arrêt de perte, par exemple en fonction de la résistance au support, du pourcentage ou de l'ATR.
- L'introduction de conditions de filtrage de tendance, comme l'indicateur ADX, pour éviter de négocier dans des marchés en crise.
- Optimisation des paramètres et vérification des retours pour différents standards et périodes.
Résumer
Cette stratégie permet de capturer des signaux de trading à moyen et long terme relativement clairs via des signaux de négociation entre les EMAs et les zones de force du RSI. Cependant, elle se comporte généralement au début d'un revirement de tendance et dans un marché instable et convient globalement aux marchés tendanciels.
Source
Pine
Related strategies
Comment
All comments (0)
No data
- 1