Stratégie de trading quantitative combinant EMA et super tendance

1
Follow
1781
Followers
Aperçu
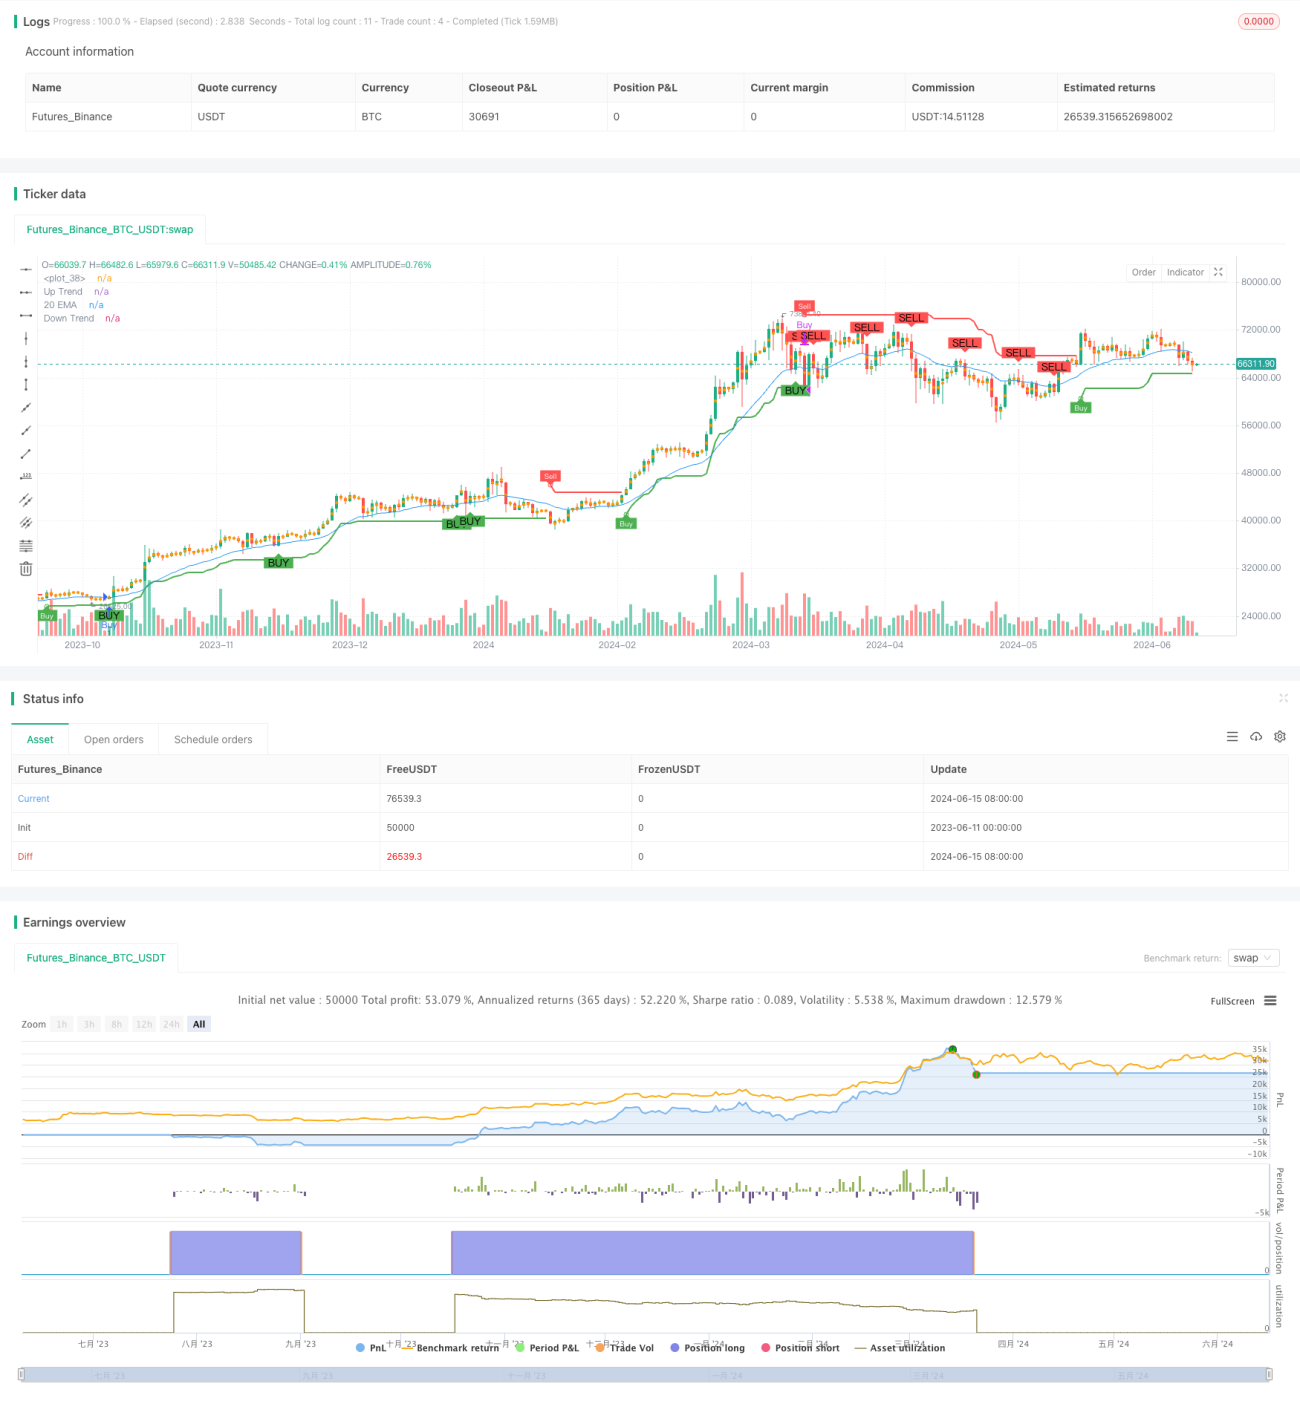
La stratégie combine les moyennes mobiles indicielles (EMA) et les indicateurs de tendance supérieure (Supertrend) pour générer des signaux d'achat et de vente. Un signal d'achat est généré lorsque le prix franchit l'EMA du 20e jour et que l'indicateur de tendance supérieure est en tendance haussière; un signal de vente est généré lorsque le prix franchit l'EMA du 20e jour et que l'indicateur de tendance supérieure est en tendance baissière.
Principe de stratégie
- Calculer l'EMA du 20e jour comme condition de filtrage de la tendance.
- Calculer l'indicateur de super-tendance, qui est basé sur la moyenne de la portée réelle (ATR) et la tendance à la pluralité des airs pour tracer les hauts et les bas.
- Les signaux d'achat et de vente sont générés en fonction de la direction de la tendance de l'indicateur de tendance supérieure et de la position relative du prix par rapport à l'EMA du 20e jour:
- Un signal d'achat est généré lorsque le prix franchit l'EMA du 20e jour par le haut et que l'indicateur de tendance supérieure est en tendance haussière.
- Un signal de vente est généré lorsque le prix est descendu au-dessous de l'EMA du 20e jour et que l'indicateur de tendance supérieure est en baisse.
- La stratégie consiste à ouvrir une position plus élevée en fonction d'un signal d'achat et à la fermer en fonction d'un signal de vente.
Avantages stratégiques
- La combinaison d'EMA et d'indicateurs de tendances supérieures permet de capturer efficacement les tendances et de réduire les faux signaux.
- L'indicateur est basé sur l'ATR et permet de régler dynamiquement la distance entre le haut et le bas de la trajectoire afin de s'adapter aux différentes fluctuations du marché.
- L'EMA sert de filtre pour les jugements de tendance, assurant la prise de position dans le sens de la tendance et améliorant la probabilité de réussite de la stratégie.
- La logique de la stratégie est simple et claire, facile à comprendre et à mettre en œuvre.
Risque stratégique
- Cette stratégie peut générer des signaux d'achat et de vente fréquents dans un marché en crise, entraînant un nombre excessif de transactions et une perte de frais de traitement.
- La stratégie s'appuie sur les EMA et les indicateurs de tendance supérieure, qui peuvent être invalidés ou retardés dans certaines conditions de marché.
- La stratégie ne prend pas en compte la gestion des risques, tels que les arrêts de perte et la gestion des positions, ce qui peut entraîner des retraits plus importants en cas de forte volatilité du marché.
Orientation de l'optimisation de la stratégie
- Adhésion à un mécanisme de stop loss, comme un stop loss dynamique selon les réglages ATR, pour contrôler la perte maximale d'une transaction.
- Optimiser les paramètres des EMA et des indicateurs de tendance supérieure, par exemple en utilisant des méthodes d'optimisation des paramètres pour trouver la meilleure combinaison de paramètres et améliorer l'adaptabilité et la stabilité de la stratégie.
- Introduction de la gestion des positions, avec un ajustement dynamique de la taille des positions en fonction de la volatilité du marché ou de la perte de compte, afin de contrôler le risque global.
- Envisagez d'ajouter d'autres conditions de filtrage, telles que le volume des transactions, la volatilité, etc., afin de réduire encore plus les faux signaux.
Résumer
La stratégie est conçue pour capturer les tendances en combinant une EMA de 20 jours et un indicateur de tendance supérieure. L'avantage de la stratégie réside dans la simplicité de la logique. La combinaison d'une EMA et d'un indicateur de tendance supérieure réduit efficacement les faux signaux.
Source
Pine
Strategy parameters
Related strategies
Comment
All comments (0)
No data
- 1