
Aperçu
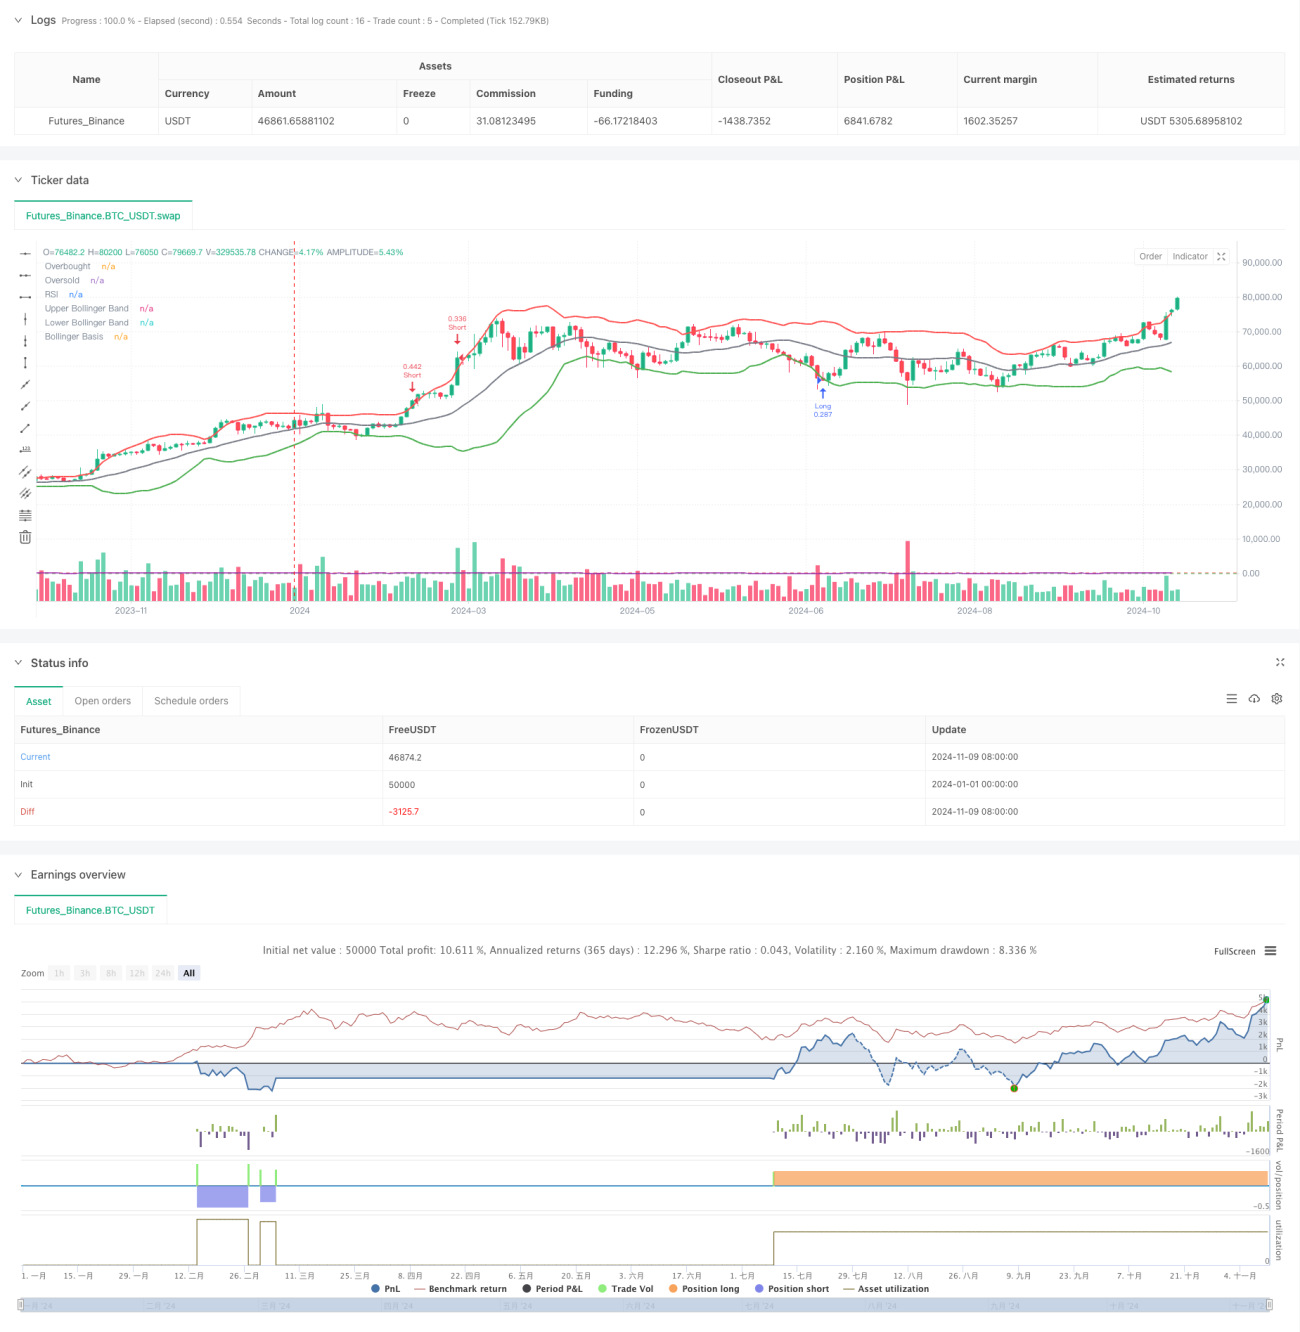
Il s'agit d'une stratégie de trading quantitative basée sur la régression des valeurs moyennes, combinant des indicateurs techniques tels que les bandes de Brin, l'indice de force relative (RSI) et l'amplitude réelle moyenne (ATR) pour effectuer des transactions en identifiant les sur-achats et les sur-vente du marché. La stratégie utilise un réglage de rapport de rendement à faible risque pour augmenter le taux de victoire et le contrôle du risque par la gestion des fonds.
Principe de stratégie
La stratégie consiste principalement à réaliser des transactions dans les domaines suivants:
- Utilisation de la bande de Brin ((20 jours) comme base de jugement pour la zone de fluctuation des prix
- Le RSI (le 14) détermine la survente du marché
- Utilisez l'ATR pour définir dynamiquement des objectifs de stop loss et de profit
- Faites un plus lorsque le prix dépasse la barre de Brin et que le RSI est inférieur à 30
- La position est close lorsque le prix dépasse la barre de Brin et que le RSI est supérieur à 70
- Retour sur le risque de 0,75 pour augmenter le taux de réussite de la stratégie
- Contrôle des risques de 2% basé sur les intérêts des comptes
Avantages stratégiques
- Une combinaison de plusieurs indicateurs techniques pour améliorer la fiabilité des signaux de trading
- Capture des occasions de survente du marché par la propriété de la régression de la valeur moyenne
- Utilisez l'ATR pour ajuster dynamiquement votre position de stop en fonction des fluctuations du marché
- Retour à faible risque pour augmenter le taux de réussite de la stratégie par rapport au réglage
- Gestion des risques en pourcentage pour une utilisation efficace des fonds
- La logique de la stratégie est claire, facile à comprendre et à mettre en œuvre
- Une bonne capacité d'expansion et d'optimisation
Risque stratégique
- La probabilité d'une rupture fréquente dans un marché en forte tendance
- Le ratio de retour sur risque faible peut entraîner des bénéfices simples relativement faibles
- Les bandes de Brin et le RSI pourraient être en retard
- La position de stop-loss peut ne pas être idéale en cas de forte volatilité du marché
- Les coûts de transaction peuvent affecter le rendement global de la stratégie
Solution:
- Ajouter un filtre de tendance
- Optimiser le temps d'entrée
- Ajustez les paramètres de l'indicateur
- Introduisez plus de signaux de confirmation
Orientation de l'optimisation de la stratégie
- L'introduction d'indicateurs de tendance pour éviter le trading à contre-courant
- Optimisation des paramètres RSI et des bandes de Brin pour une meilleure précision du signal
- Résultats de l'analyse de l'impact sur le marché
- Ajouter un indicateur de volume comme confirmation auxiliaire
- Pensez à ajouter un filtre temporel pour éviter les transactions à des périodes spécifiques
- Développer des mécanismes de paramètres d'adaptation pour améliorer l'adaptabilité des stratégies
- Amélioration du système de gestion des fonds et optimisation de la taille des positions
Résumer
La stratégie construit un système de trading robuste en combinant le principe de la régression des valeurs moyennes et de multiples indicateurs techniques. Des réglages à faible taux de rendement au risque contribuent à améliorer les chances de victoire, tandis qu'une gestion rigoureuse des risques assure la sécurité des fonds. Bien qu'il y ait des risques inhérents, la stratégie est susceptible d'obtenir de meilleures performances grâce à une optimisation et à un perfectionnement continus.
- 1