Stratégies de trading combinant l'analyse technique multi-périodes avec le sentiment du marché

Aperçu
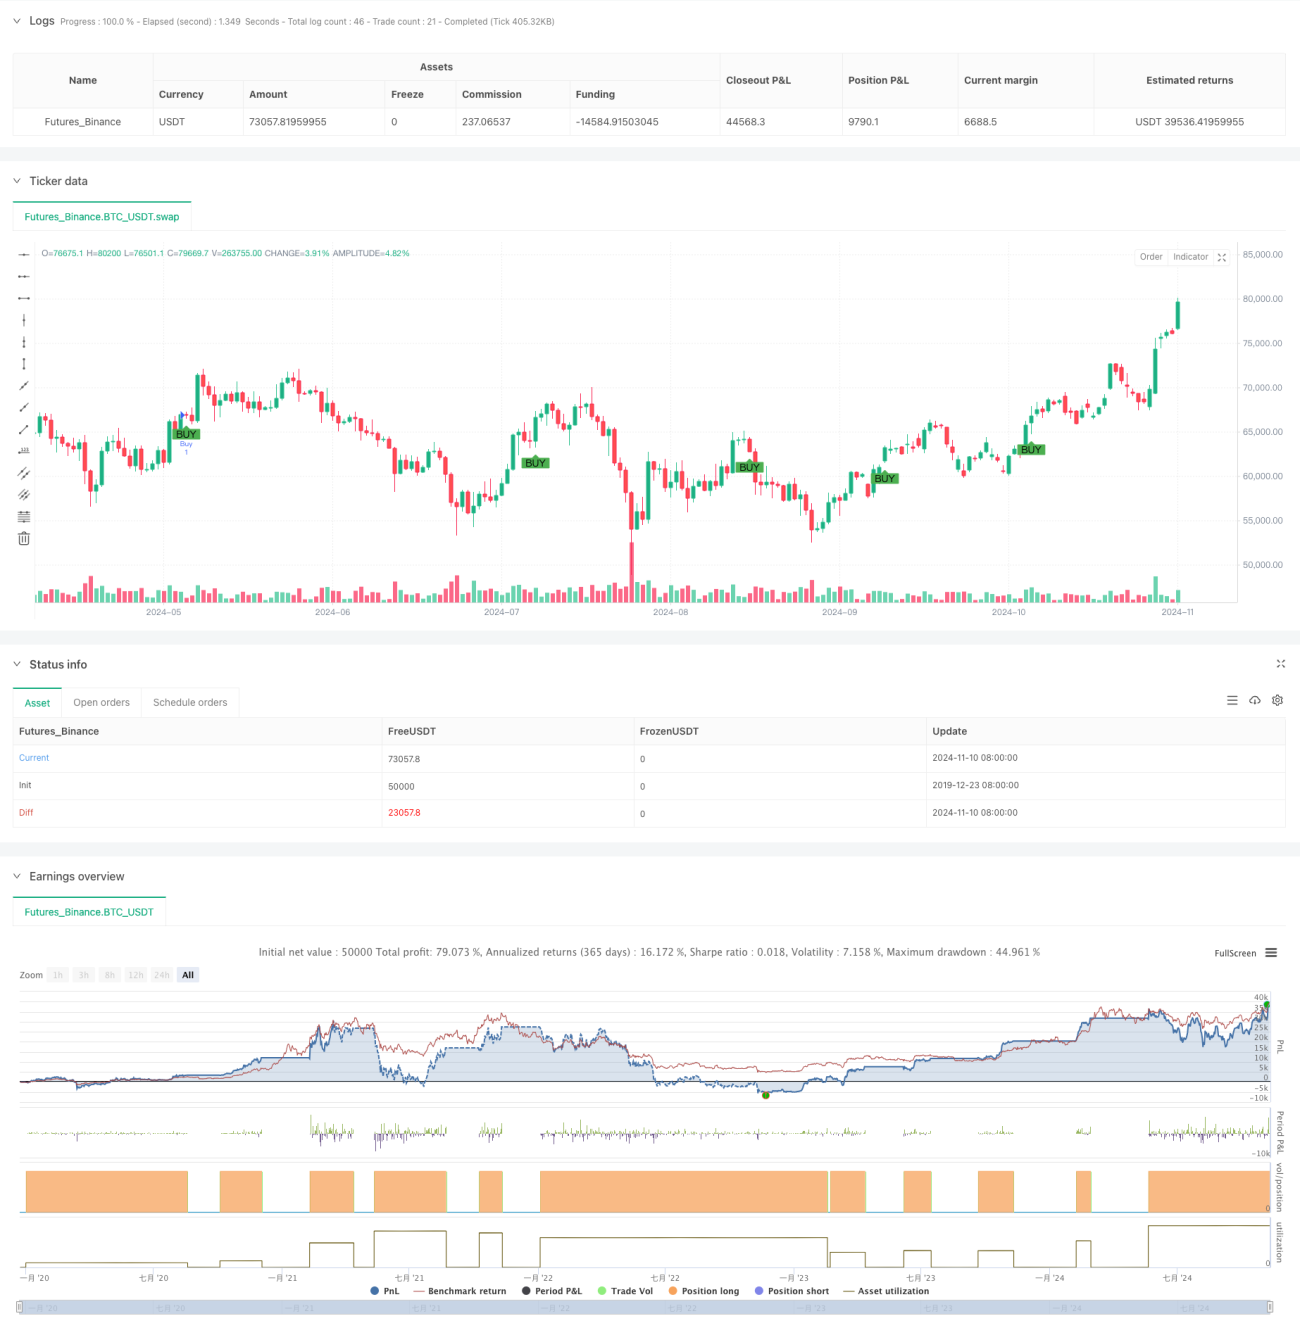
La stratégie est un système de négociation intégré qui combine plusieurs indicateurs techniques et l'émotion du marché. Le cœur de la stratégie utilise des signaux croisés de moyennes mobiles à court et à long terme (SMA) et une combinaison avec l'indicateur MACD pour confirmer la direction de la tendance. En outre, la stratégie intègre l'indicateur de l'émotion du marché RSI, ainsi qu'un système de reconnaissance des formes du graphique, y compris l'identification des formes de double sommet / double pied et de tête et d'épaule.
Principe de stratégie
La stratégie est basée sur les éléments suivants:
- Système de moyennes mobiles à plusieurs périodes: analysez les tendances à l'aide de SMA à 10 et 30 périodes
- Indicateur MACD: utilise le paramètre standard (de 12, 26 et 9) pour la confirmation de tendance
- Surveillance de l'émotion du marché: le RSI est utilisé pour juger les surachats et les survente
- Reconnaissance de forme graphique: système de reconnaissance automatique comprenant une forme double-top/double-bottom et une forme tête-épaule
- Filtrage temporel: les opportunités de négociation se concentrent sur des périodes de négociation spécifiques
- Identification du point de résistance: utilisation de la rétrocession de 20 cycles pour déterminer le point de résistance principal
Les conditions d'achat doivent être remplies: être au moment de la transaction cible, porter un SMA à court terme sur un SMA à long terme et que l'indicateur MACD affiche un signal à plusieurs têtes.
Les conditions de vente doivent être remplies: le prix a atteint le point de résistance majeur et l'indicateur MACD affiche un signal de tête vide.
Avantages stratégiques
- Confirmation de signaux multidimensionnels: une combinaison d'indicateurs techniques et de formes graphiques pour améliorer la fiabilité des signaux de transaction
- Une meilleure gestion des risques: un mécanisme de sortie anticipée basé sur le RSI
- Intégration de l'humeur des marchés: analysez l'humeur des marchés à l'aide de l'indicateur RSI pour éviter de trop suivre les baisses
- L'automatisation de la reconnaissance de forme: réduire les biais de jugement subjectif
- Filtrage temporel: concentrez-vous sur les périodes où le marché est le plus actif pour améliorer l'efficacité des transactions
Risque stratégique
- Sensitivité des paramètres: les paramètres de plusieurs indicateurs techniques peuvent affecter les performances de la stratégie
- Risque de retardation: les moyennes mobiles et le MACD ont un certain retard
- Accurace de la reconnaissance de forme: les systèmes de reconnaissance automatique peuvent être mal interprétés
- Dépendance aux conditions du marché: les faux signaux peuvent être fréquents dans les marchés en crise
- Limitation dans le temps: les opportunités de négocier uniquement à certains moments peuvent être manquées à d'autres moments
Orientation de l'optimisation de la stratégie
- Adaptation des paramètres: introduire un mécanisme d'ajustement des paramètres adaptatifs pour ajuster automatiquement les paramètres de l'indicateur en fonction des fluctuations du marché
- Système de pondération des signaux: mise en place d'un système de pondération des signaux des indicateurs pour améliorer l'exactitude des décisions
- Optimisation de l'arrêt des pertes: augmentation des mécanismes d'arrêt des pertes dynamiques et amélioration des capacités de contrôle des risques
- Renforcement de la reconnaissance des formes: l'introduction d'algorithmes d'apprentissage automatique améliore la précision de la reconnaissance des formes des graphiques
- Élargissement du cycle de rétractation: effectuer des rétractations à différents cycles de marché pour vérifier la stabilité de la stratégie
Résumer
Il s'agit d'une stratégie de négociation globale qui, grâce à la combinaison de plusieurs indicateurs techniques et de l'humeur du marché, établit un système de négociation relativement complet. L'avantage de la stratégie réside dans la reconnaissance de signaux multidimensionnels et un mécanisme de gestion du risque parfait, mais il existe également des problèmes tels que la sensibilité des paramètres et l'exactitude de la reconnaissance de la forme.
- 1