
Aperçu
Cette stratégie est un système de suivi des tendances basé sur l'indicateur de la moyenne réelle de l'amplitude (ATR) pour identifier les tendances du marché en calculant dynamiquement la gamme des fluctuations des prix et en gérant les risques en combinant un mécanisme d'arrêt et de perte adapté. La stratégie utilise une méthode d'analyse à cycles multiples pour ajuster dynamiquement les conditions de déclenchement des signaux de négociation en multipliant l'ATR afin de suivre avec précision les fluctuations du marché.
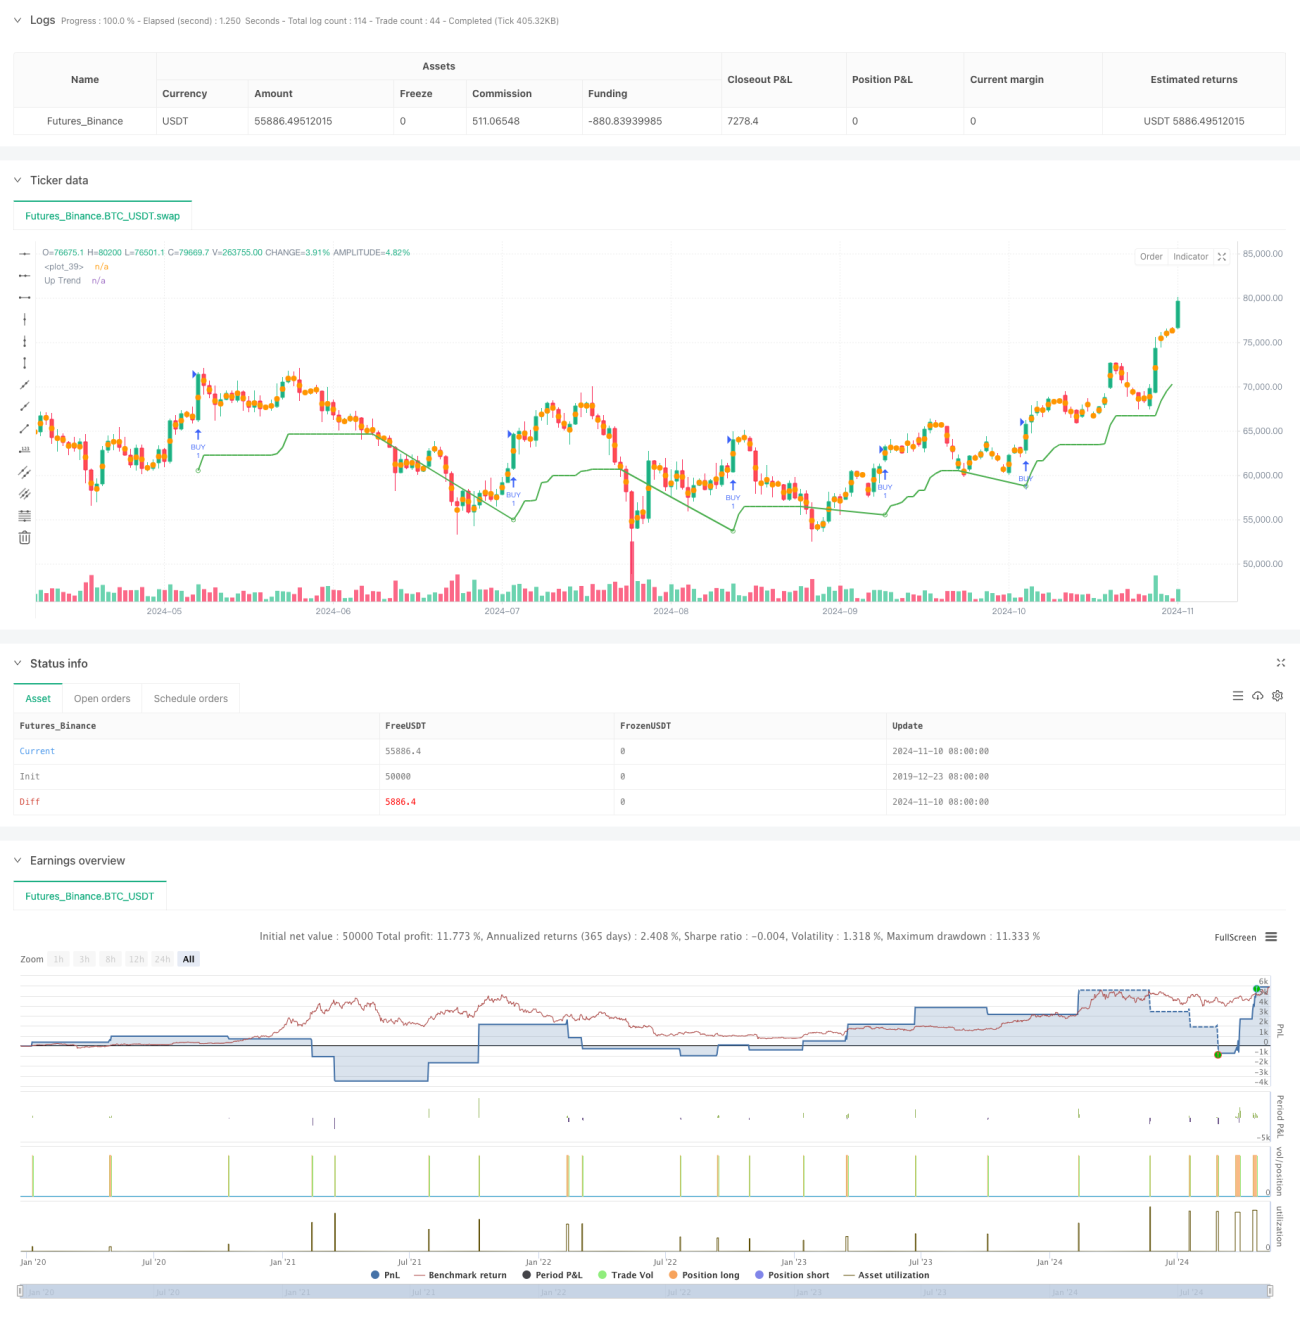
Principe de stratégie
Le cœur de la stratégie est basé sur le calcul dynamique de l'indicateur ATR, calculant l'amplitude réelle du marché à partir des paramètres de cycle définis (la période 10 par défaut). Construire une ligne d'orbite ascendante et descendante en utilisant le multiplicateur ATR (la période 3.0 par défaut) et déclencher un signal de transaction lorsque le prix franchit la ligne d'orbite.
- Bases d'amplitude calculées avec SMA ou ATR standard
- Calcul dynamique des lignes d'orbite ascendantes et descendantes comme référence de suivi des tendances
- Détermination de la direction de la tendance par le croisement de la ligne de prix et de l'orbite
- Le signal de transaction est déclenché au point de conversion de la tendance
- Mise en œuvre d'un système de stop-loss dynamique basé sur le pourcentage
Avantages stratégiques
- Adaptation: réaction aux fluctuations du marché via l'ATR
- Risque maîtrisé: un système de stop-loss intégré pour contrôler efficacement le risque de chaque transaction
- Flexibilité des paramètres: les paramètres clés tels que la période ATR, le multiplicateur, etc. peuvent être ajustés en fonction des caractéristiques du marché
- Claireté visuelle: offre une interface graphique complète, comprenant des marqueurs de tendances et des signaux d'avertissement
- Gestion du temps: prise en charge de fenêtres de temps de transaction personnalisées, amélioration de l'applicabilité des stratégies
Risque stratégique
- Risque de renversement de tendance: des faux signaux peuvent être fréquents dans les marchés en crise
- Sensibilité aux paramètres: le choix des cycles et des multiplications ATR a un impact significatif sur la performance de la stratégie
- Dépendance à l'environnement du marché: les points de glissement peuvent être plus importants pendant les périodes de forte volatilité
- Paramètres de stop-loss: le stop-loss à pourcentage fixe peut ne pas être adapté à toutes les conditions du marché
Orientation de l'optimisation de la stratégie
- L'introduction d'analyses sur plusieurs périodes permettra d'améliorer la précision des tendances
- Ajout de confirmation de l'indicateur de transaction pour améliorer la fiabilité du signal
- Développer des mécanismes de stop-loss adaptatifs, adaptés aux fluctuations du marché
- Augmentation des filtres d'intensité de tendance pour réduire les fausses signaux
- Optimisation de l'entrée en bourse combinée à des indicateurs de volatilité
Résumer
Il s'agit d'une stratégie de suivi de tendance bien conçue, permettant de suivre avec précision les fluctuations du marché via les indicateurs ATR et de gérer les risques en combinaison avec un mécanisme de stop-loss. L'avantage de la stratégie réside dans sa forte adaptabilité et sa maîtrise des risques, mais il faut toujours tenir compte de l'impact de l'environnement du marché sur la performance de la stratégie.
- 1