Version avancée de la stratégie de trading quantitatif à tendance dynamique MACD

Aperçu
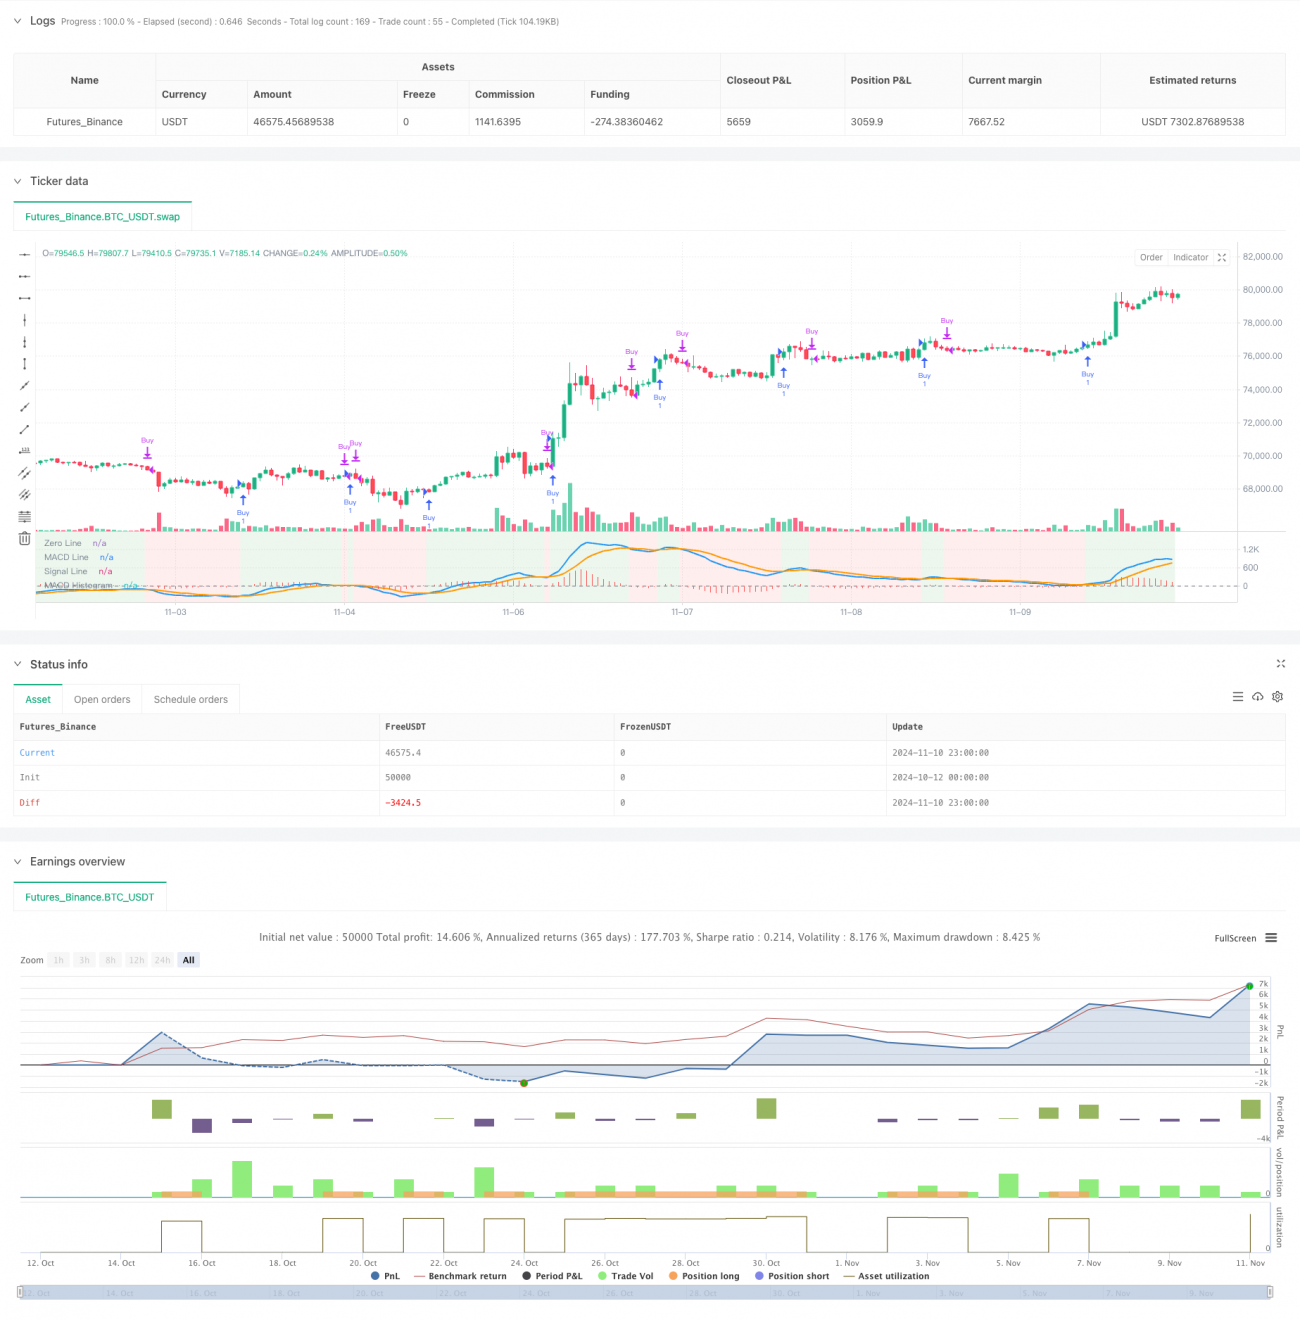
Cette stratégie est un système de trading quantitatif avancé basé sur le MACD (Moving Average Convergence Spread Indicator) qui améliore la précision des décisions de négociation grâce à un affichage dynamique en arrière-plan et à une combinaison de paramètres prédéfinis. Le cœur de la stratégie est de capturer les points de conversion des tendances du marché à travers les signaux croisés de l'indicateur MACD et de montrer de manière visuelle l'état du marché.
Principe de stratégie
La stratégie utilise dix paramètres MACD différents, dont les paramètres standard sont les suivants: [12, 26, 9], [short], [5, 35, 5], [long], [19, 39, 9], etc., pour s'adapter à différents environnements de marché et styles de négociation. Lorsque la ligne MACD se trouve à la croisée de la ligne de signal avec l'or, le système génère un signal d'achat et de vente.
Avantages stratégiques
- Flexibilité des paramètres: dix combinaisons de paramètres prédéfinis sont disponibles pour s'adapter à différents environnements de marché
- Retour visuel clair: affichage intuitif des tendances du marché grâce à des changements dynamiques de couleur de fond
- Signal clair: génération d'un signal de vente ou d'achat clair basé sur le croisement MACD
- Adaptabilité: utilisation dans différentes périodes de temps
- Structure de code claire: utilisation de la structure de commutation des paramètres pour faciliter la maintenance et l'extension
Risque stratégique
- Risque de retard: le MACD, en tant qu'indicateur de retard, peut générer des signaux de retard dans des marchés très volatils
- Risque de fausse rupture: un faux signal de croisement peut se produire dans les marchés à la barre
- Paramètres dépendants: différentes combinaisons de paramètres ont un rendement différent dans différents environnements de marché
- Limitation des conditions du marché: risque de mauvaise performance dans un environnement de marché très volatil ou peu liquidité
Orientation de l'optimisation de la stratégie
- Introduction d'un filtre de volatilité pour filtrer les signaux de négociation des périodes de forte volatilité du marché
- Ajout d'indicateurs de confirmation de tendance tels que RSI ou ATR pour améliorer la fiabilité du signal
- Optimisation des paramètres d'adaptation, en ajustant les paramètres MACD en fonction de la dynamique du marché
- Augmentation de la fonction de prévention des dommages et de la gestion des risques
- Ajout d'analyses de volumes de transactions pour améliorer la fiabilité du signal
Résumer
Il s'agit d'une version avancée de la stratégie MACD, structurée et logiquement claire. L'utilité et l'opérabilité de la stratégie ont été considérablement améliorées grâce à des préréglages multiparamétriques et à des commentaires visuels dynamiques. Bien qu'il y ait des risques inhérents, la stratégie est susceptible de devenir un système de trading robuste après avoir été améliorée grâce à l'orientation d'optimisation fournie.
- 1