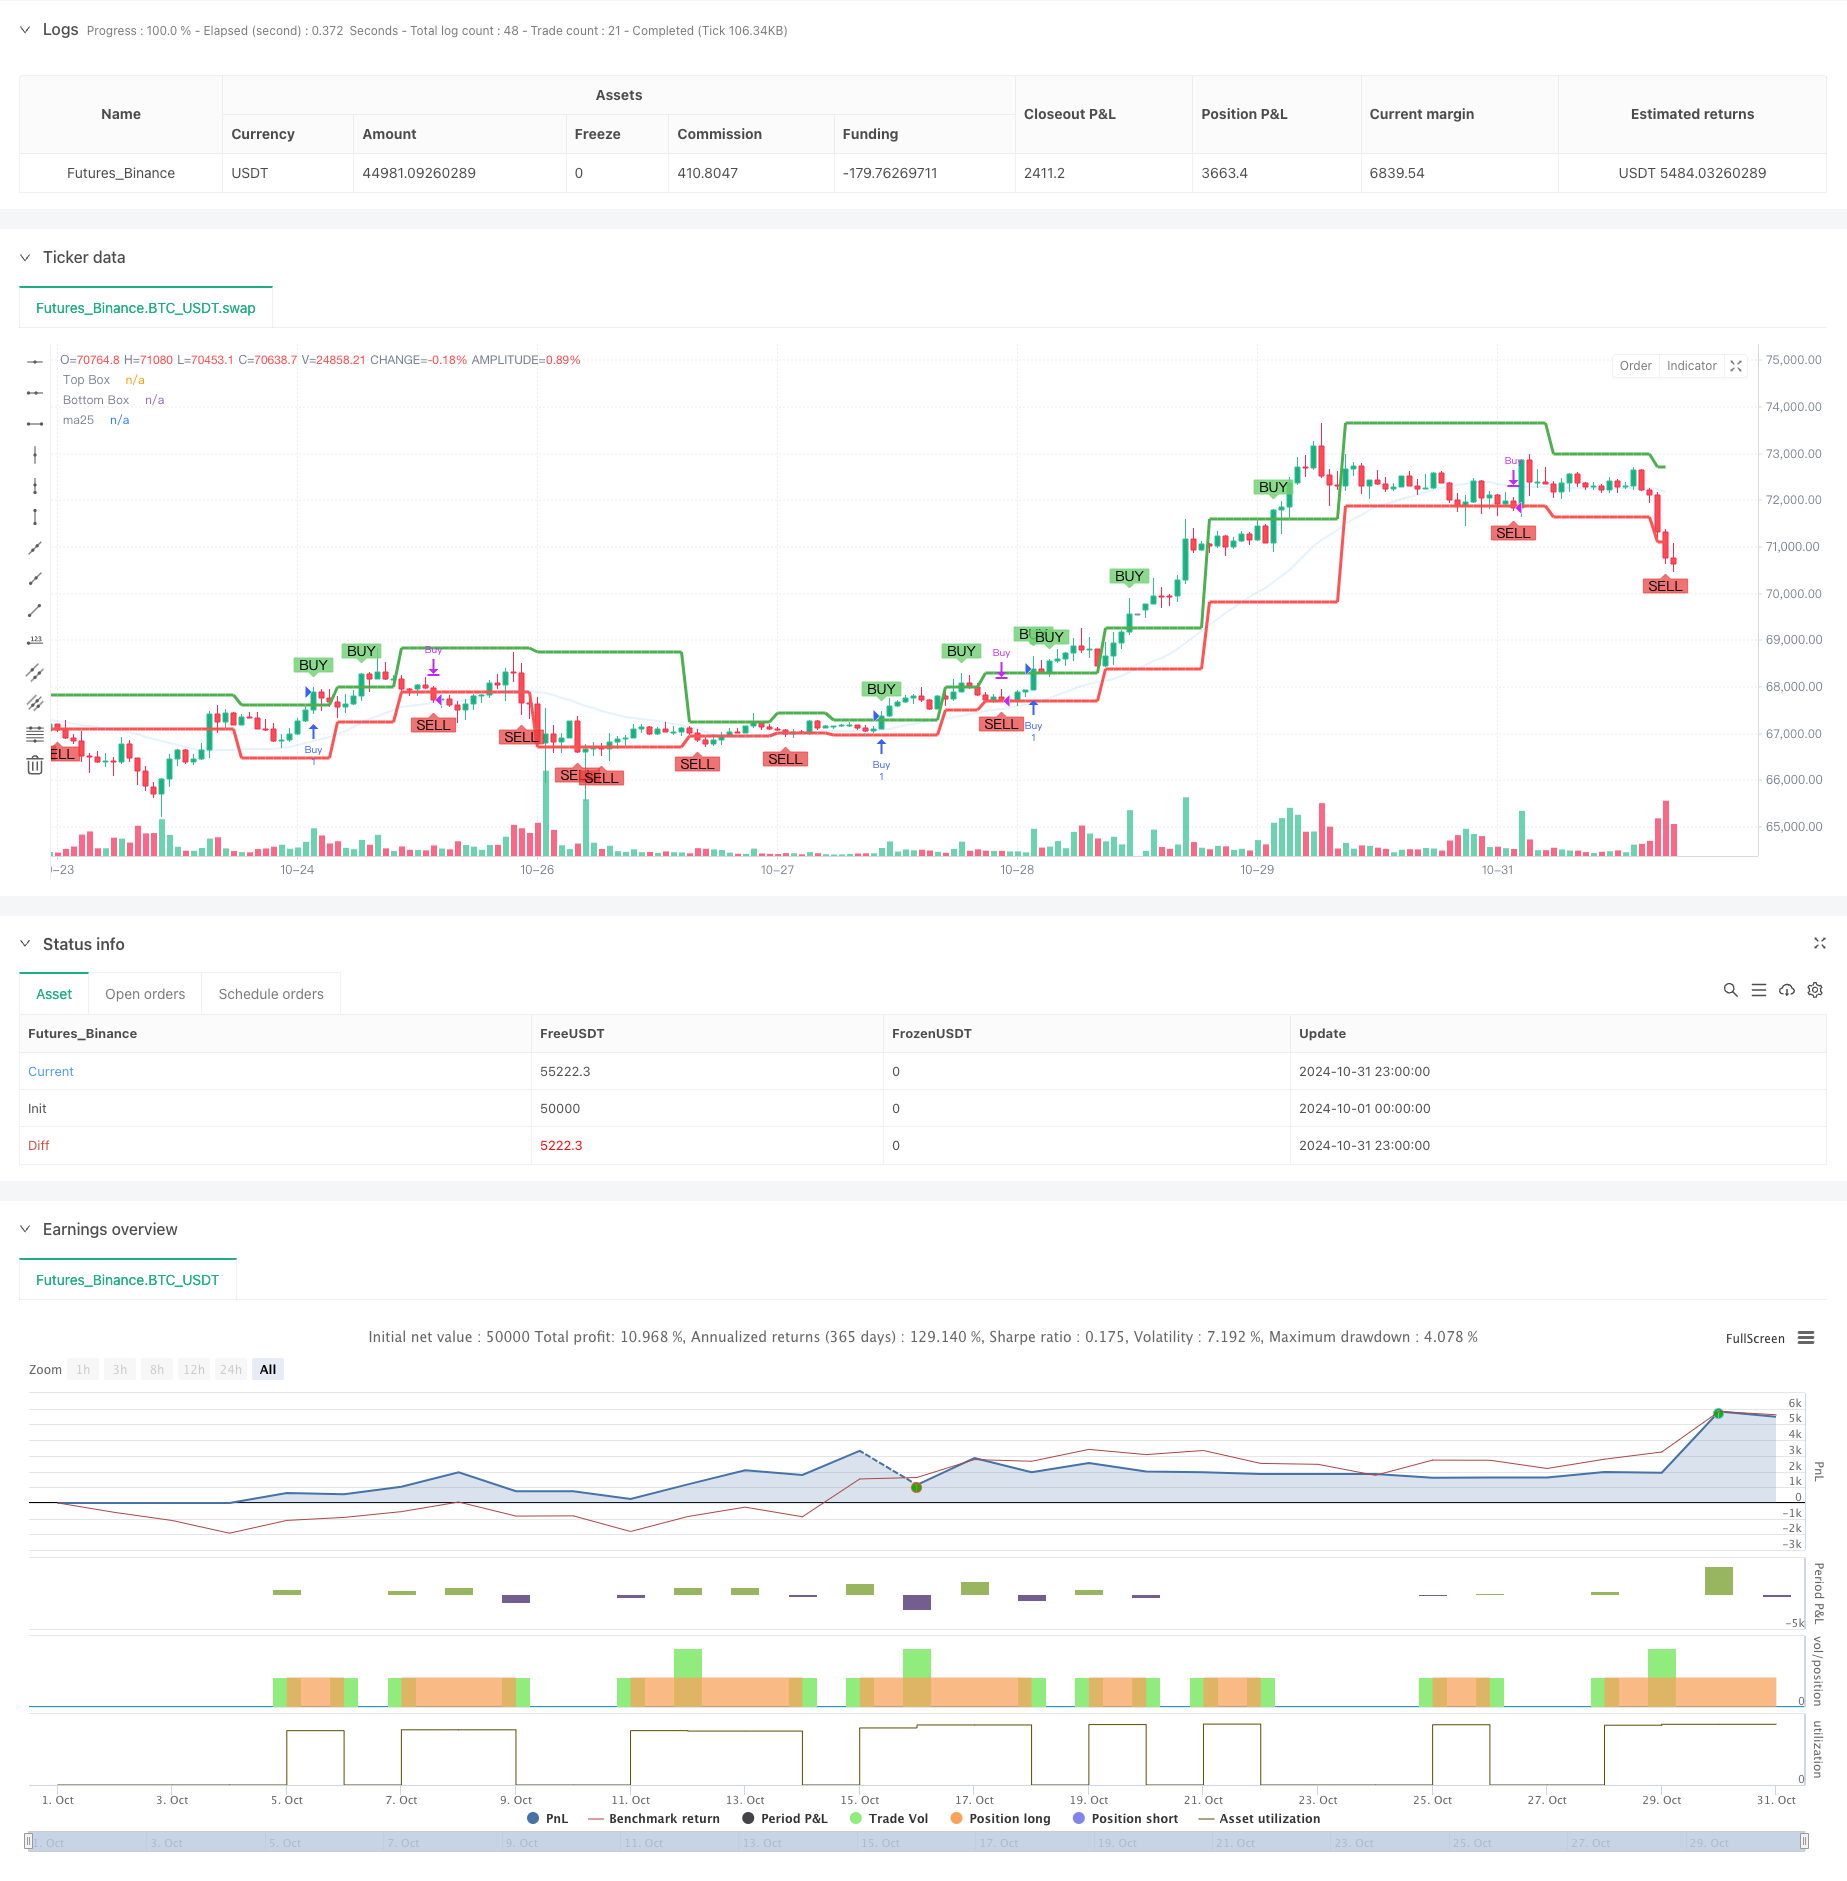
Aperçu
Cet article présente un système de suivi des tendances combinant une boîte de Darvas et une moyenne mobile à 25 cycles. Cette stratégie permet d’identifier les boîtes qui se forment entre les zones de couverture des prix et, combinée à la confirmation de la tendance uniforme, de capturer les tendances fortes lors de la rupture. La conception du système prend en compte la continuité des tendances et le filtre de fausse rupture, offrant aux traders un cadre d’entrée et de sortie complet.
Principe de stratégie
La stratégie comporte trois composantes principales:
- Construction de la boîte de Davos: le système détermine les limites de la boîte en calculant les hauts et les bas des 5 derniers cycles. Le sommet de la boîte est déterminé par le nouveau sommet et le bas par le point le plus bas dans la zone correspondante.
- Confirmation de la tendance de la moyenne: introduction de la moyenne mobile simple à 25 cycles comme filtre de tendance, la prise de position n’est envisagée que lorsque le prix est au-dessus de la MA25
- Le signal de transaction est généré:
- Signaux d’achat: le prix a atteint le sommet de la boîte et se trouve au-dessus de la MA25
- Signal de vente: le prix a atteint le bas de la boîte
Avantages stratégiques
- La tendance est à suivre les tendances:
- Le début de la tendance à la capture par casse-tête
- Le filtrage MA25 est utilisé pour assurer la direction de la tendance dominante.
- Optimisation de la qualité du signal:
- Le mécanisme de double confirmation réduit le risque de fausse intrusion
- Les conditions d’entrée et de sortie sont claires et évitent les jugements subjectifs.
- Le risque est bien maîtrisé:
- Une zone de rupture naturelle au fond de la caisse
- MA25 fournit une protection supplémentaire contre les tendances
Risque stratégique
- Le risque d’un choc des marchés:
- Des ruptures fréquentes peuvent entraîner des pertes continues
- Recommandé sur les marchés à forte tendance
- Le risque de retard:
- La formation du corps prend du temps et peut manquer certaines étapes.
- La MA25 est un retard de la moyenne à moyen terme.
- Risques liés à la gestion des fonds:
- Il est nécessaire d’établir un ratio raisonnable de fonds pour chaque transaction.
- Recommandation d’ajustement de position associé à la dynamique de la volatilité
Orientation de l’optimisation de la stratégie
- Optimisation des paramètres:
- Le cycle de la boîte peut être ajusté en fonction des caractéristiques du marché
- Les cycles de MA peuvent être ajustés en fonction des caractéristiques du cycle du marché
- Amélioration du signal:
- Un mécanisme de confirmation de livraison peut être ajouté
- Une révision de l’introduction d’un mécanisme d’arrêt dynamique des pertes
- Le contrôle des risques est renforcé:
- Ajouter un filtre de volatilité
- Réaliser une gestion dynamique des positions
Résumer
Cette stratégie, combinant la théorie classique du cube de Davos et le suivi de la tendance des moyennes mobiles, construit un système de négociation robuste. Le principal avantage du système réside dans la capacité de capturer efficacement les comportements tendancieux tout en contrôlant les risques grâce à de multiples mécanismes de filtrage. Bien qu’il y ait un certain retard, la stratégie est capable d’obtenir des performances stables dans les marchés tendancieux grâce à une optimisation des paramètres et une gestion des risques raisonnables.
/*backtest
start: 2024-10-01 00:00:00
end: 2024-10-31 23:59:59
period: 1h
basePeriod: 1h
exchanges: [{"eid":"Futures_Binance","currency":"BTC_USDT"}]
*/

//@version=5
strategy("DARVAS BOX with MA25 Buy Condition", overlay=true, shorttitle="AEG DARVAS")

// Input for box length
boxp = input.int(5, "BOX LENGTH")

// Calculate 25-period moving average
ma25 = ta.sma(close, 25)

// Lowest low and highest high within the box period
LL = ta.lowest(low, boxp)
k1 = ta.highest(high, boxp)
k2 = ta.highest(high, boxp - 1)
k3 = ta.highest(high, boxp - 2)

// New high detection
NH = ta.valuewhen(high > k1[1], high, 0)

// Logic to detect top and bottom of Darvas Box
box1 = k3 < k2
TopBox = ta.valuewhen(ta.barssince(high > k1[1]) == boxp - 2 and box1, NH, 0)
BottomBox = ta.valuewhen(ta.barssince(high > k1[1]) == boxp - 2 and box1, LL, 0)

// Plot the top and bottom Darvas Box lines
plot(TopBox, linewidth=3, color=color.green, title="Top Box")
plot(BottomBox, linewidth=3, color=color.red, title="Bottom Box")
plot(ma25, color=#2195f31e, linewidth=2, title="ma25")

// --- Buy and Sell conditions ---

// Buy when price breaks above the Darvas Box AND MA15
buyCondition = ta.crossover(close, TopBox) and close > ma25

// Sell when price drops below the Darvas Box
sellCondition = ta.crossunder(close, BottomBox)

// --- Buy and Sell Signals ---

// Plot BUY+ and SELL labels
plotshape(series=buyCondition, title="Buy+ Signal", location=location.abovebar, color=#72d174d3, style=shape.labeldown, text="BUY")
plotshape(series=sellCondition, title="Sell Signal", location=location.belowbar, color=color.rgb(234, 62, 62, 28), style=shape.labelup, text="SELL")

// --- Strategy execution ---

if (buyCondition)
    strategy.entry("Buy", strategy.long)

if (sellCondition)
    strategy.close("Buy")