
Aperçu
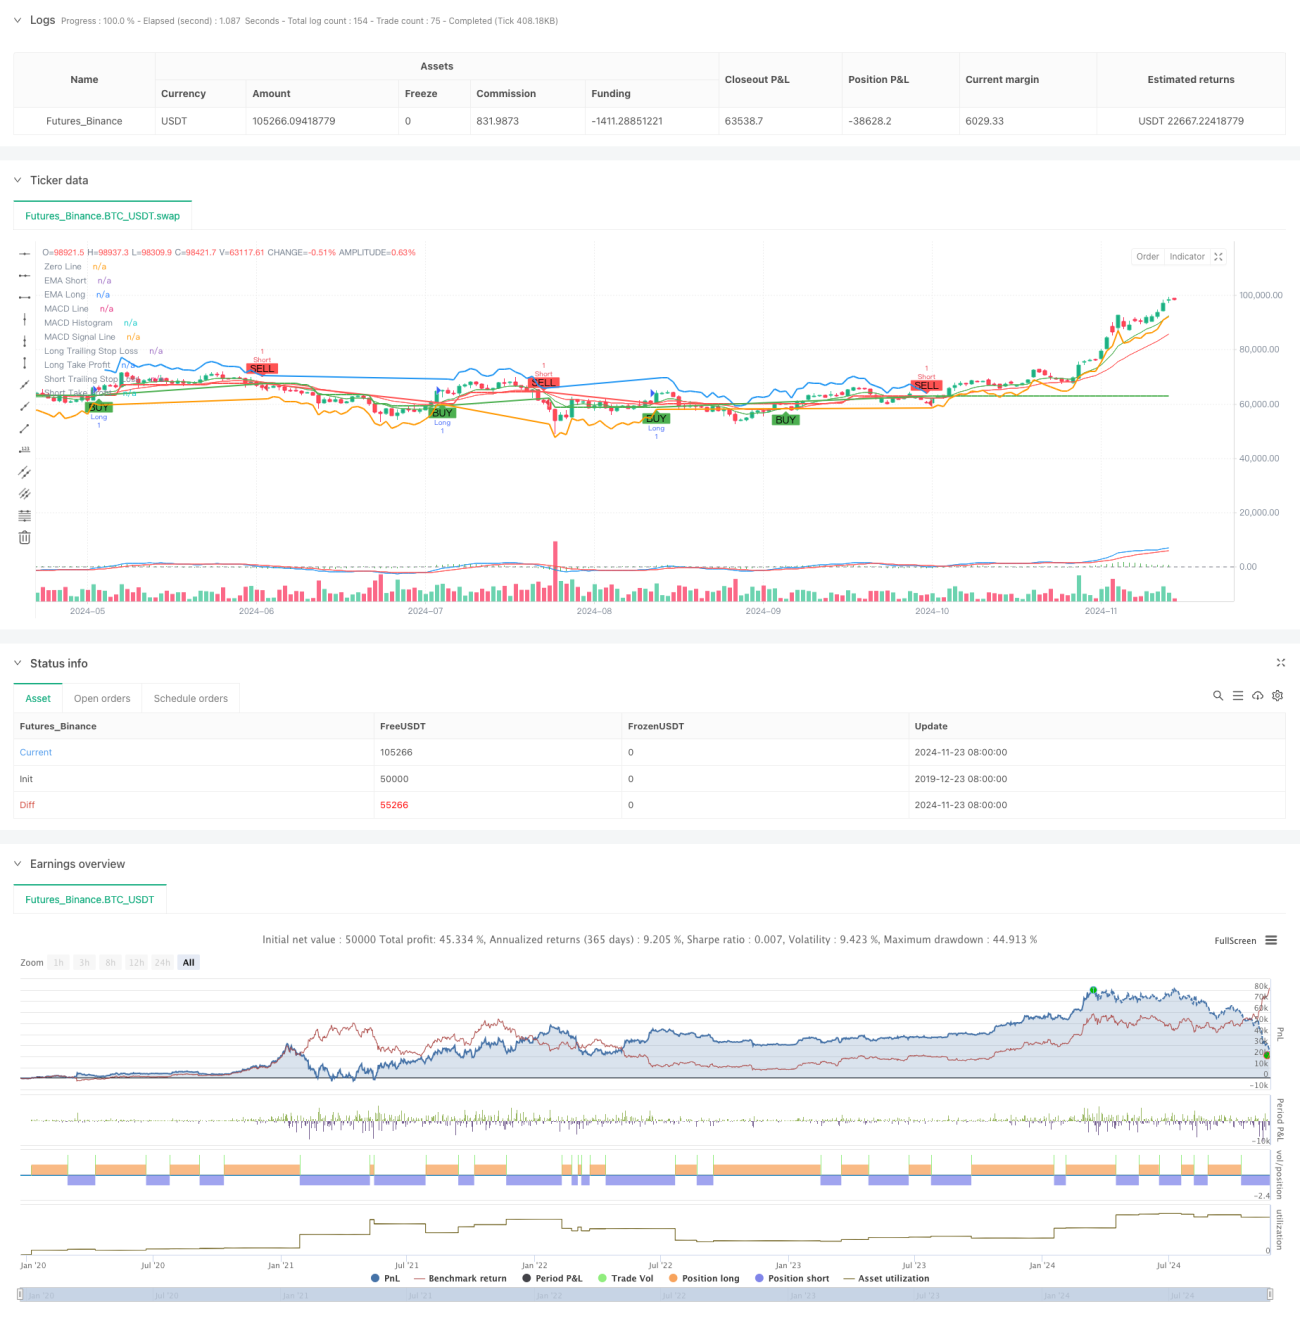
Cette stratégie est un système complet de trading de tendance, combinant une analyse multi-temporelle, un système de moyennes mobiles, des indicateurs de momentum et de volatilité. Le système identifie la direction de la tendance via le croisement des moyennes mobiles exponentielles (EMA) à court et long terme, utilise le Relative Strength Index (RSI) pour les conditions de surachat/survente, confirme le momentum avec le MACD, et utilise une EMA d'un timeframe supérieur comme filtre de tendance. Le système emploie un stop-loss dynamique basé sur l'ATR et un objectif de profit, s'adaptant de manière réactive à la volatilité du marché.
Principe de la stratégie
La stratégie utilise un mécanisme de validation multi-couche pour les décisions de trading :
- Couche d'identification de tendance : capture les changements de tendance via le croisement des EMA 9 et 21.
- Couche de confirmation du momentum : vérifie le momentum via le croisement et la direction du MACD (12,26,9).
- Filtre de surachat/survente : utilise le RSI (14) aux niveaux 70/30.
- Confirmation sur timeframe supérieur : utilise facultativement une EMA journalière comme filtre de tendance.
- Couche de gestion des risques : utilise un ATR de 1,5 fois comme stop suiveur et 2 fois l'ATR pour fixer l'objectif de profit.
Le système n'ouvre une position qu'après avoir satisfait plusieurs conditions : croisement des EMA, RSI hors zones extrêmes, direction correcte du MACD, et confirmation de tendance sur le timeframe supérieur. La sortie combine un stop suiveur et un objectif de profit fixe.
Avantages de la stratégie
- Mécanisme de validation multiple réduisant significativement les faux signaux
- Filtre de tendance sur timeframe supérieur améliorant le taux de réussite
- Stop-loss dynamique basé sur la volatilité, très adaptable
- Système complet de gestion des risques
- Paramètres ajustables selon les caractéristiques du marché
- Supporte le trading bidirectionnel, adaptable à différents environnements
- Combinaison d'indicateurs prenant en compte à la fois la tendance et le momentum
Risques de la stratégie
- Multiples conditions pouvant entraîner des opportunités de trading manquées
- Trading potentiellement fréquent dans les marchés en range
- Optimisation des paramètres pouvant conduire à un surajustement
- Confirmation sur timeframe supérieur pouvant retarder l'entrée en position
Solutions :
- Ajustement dynamique des paramètres selon les caractéristiques du marché
- Augmentation de la flexibilité dans le choix de la direction de trading
- Introduction d'un mécanisme de filtrage par volatilité
- Optimisation d'un mécanisme d'adaptation des paramètres
Directions d'optimisation de la stratégie
- Introduire un filtre de volatilité pour ajuster la taille des positions en période de forte volatilité
- Développer un mécanisme d'adaptation des paramètres, ajustés dynamiquement selon l'état du marché
- Ajouter un indicateur de volume pour confirmer la validité des signaux
- Optimiser la logique de jugement de tendance sur le timeframe supérieur
- Améliorer le plan de stop-loss, envisager l'ajout d'un stop temporel
- Développer un module d'évaluation de la performance de la stratégie
Résumé
Cette stratégie est un système complet de trading de tendance. Grâce à la combinaison de multiples indicateurs techniques et à une gestion stricte des risques, elle permet d'obtenir des gains stables sur les marchés en tendance. Le système est hautement extensible et peut être adapté à différents environnements de marché via optimisation. Il est recommandé de procéder à des backtests et à une optimisation des paramètres avant de l'utiliser en trading réel.
- 1