Système de trading quantitatif croisé dynamique multi-périodes MACD-EMA

Aperçu
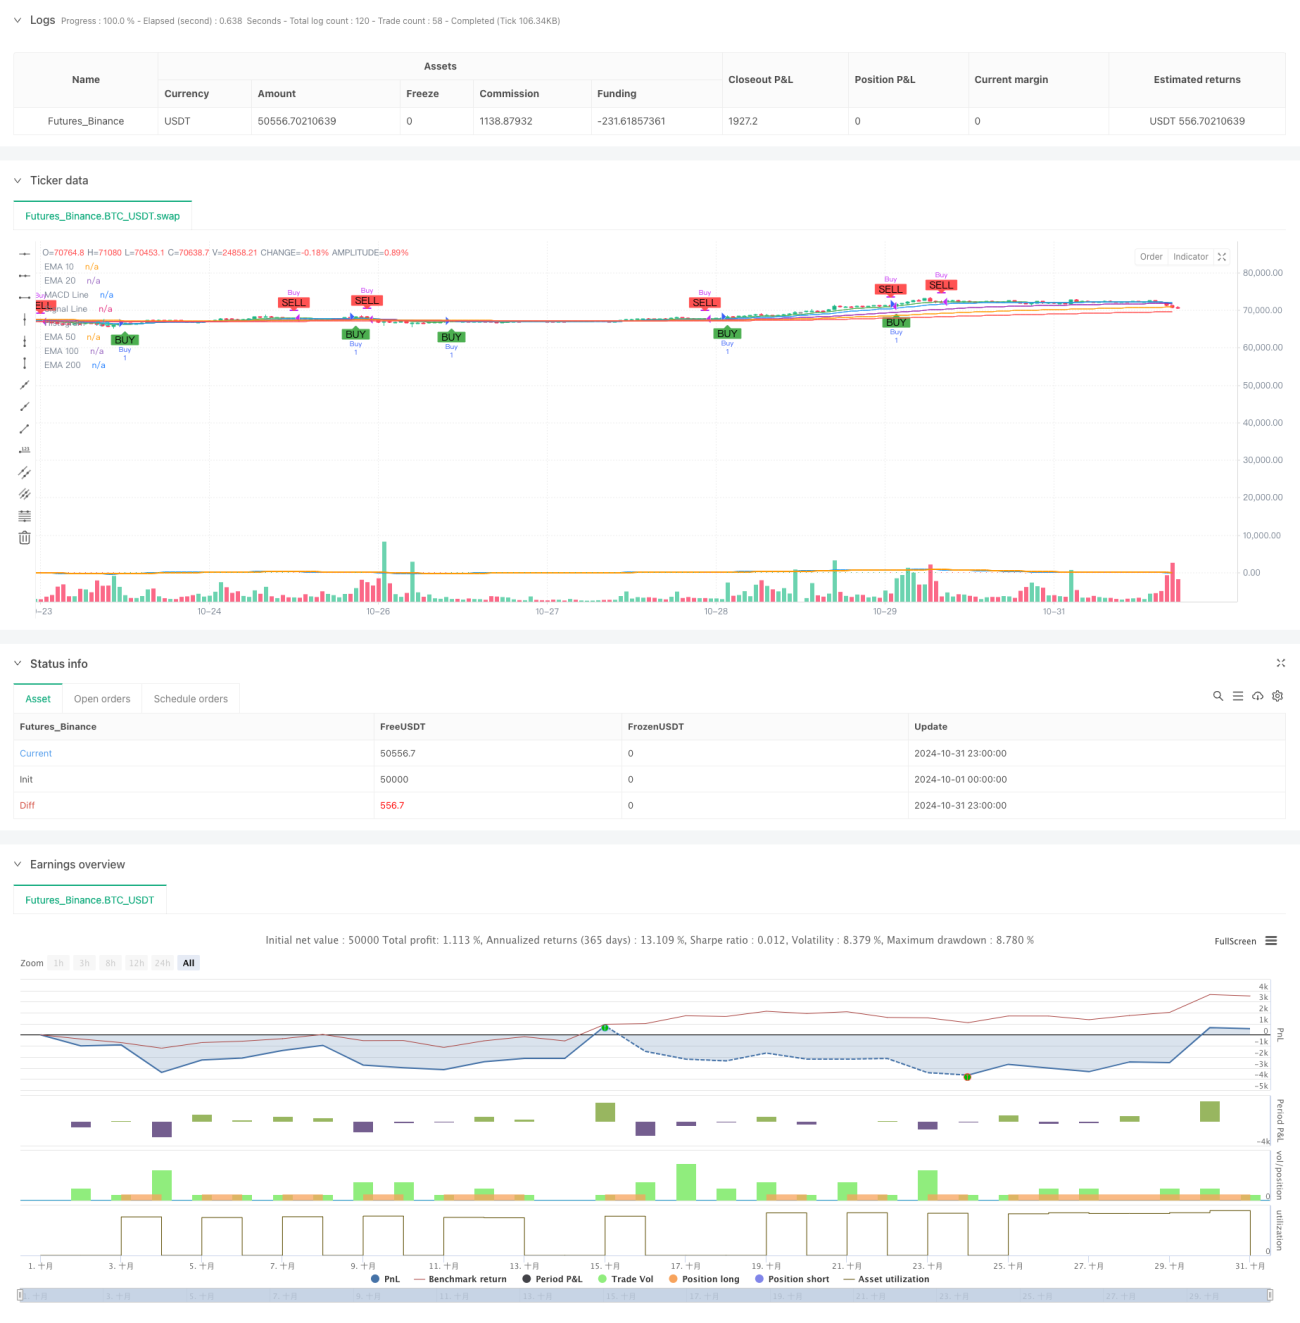
La stratégie est un système de trading quantifié basé sur les indicateurs MACD et EMA à périodes multiples. La stratégie construit un système de prise de décision de trading complet en combinant les caractéristiques de suivi de tendance de l'indicateur MACD et les caractéristiques de résistance au support de plusieurs courbes EMA. Le système comprend non seulement la génération de signaux d'achat et de vente, mais intègre également une fonction d'alerte en temps réel qui aide les traders à saisir les opportunités de marché en temps opportun.
Principe de stratégie
La logique centrale de la stratégie est basée sur deux principaux indicateurs techniques. Le premier est l'indicateur MACD, composé d'une ligne rapide (circuit 12) et d'une ligne lente (circuit 26), qui génère un signal de transaction par la croisée des deux lignes.
Avantages stratégiques
- Système de signaux amélioré: combinaison des fonctionnalités de suivi de tendance de l'indicateur MACD et de la fonction de confirmation de tendance des EMAs multiples.
- Analyse multidimensionnelle: fournit une référence à la structure du marché à plusieurs niveaux pour la prise de décision de négociation par le biais d'EMA à différents cycles.
- Système d'alerte en temps réel: fonctionnalité d'alerte en temps réel intégrée aux signaux d'achat et de vente pour aider les traders à détecter les opportunités de trading en temps réel.
- L'effet visuel est puissant: la stratégie affiche clairement les signaux d'achat et de vente sur le graphique, ce qui permet aux traders de comprendre intuitivement les mouvements du marché.
- Les paramètres peuvent être ajustés: les paramètres de base peuvent être personnalisés pour être optimisés en fonction des différentes conditions du marché.
Risque stratégique
- Risque de retard: le MACD et l'EMA sont des indicateurs de retard qui peuvent être signalés par un retard dans un marché très volatil.
- Risque de fausse percée: il peut y avoir de fréquents signaux de fausse percée pendant la phase de tri horizontal.
- Risque de renversement de tendance: à un tournant majeur de la tendance, la capacité d'adaptation de la stratégie peut être insuffisante.
- Sensitivité des paramètres: dans différents environnements de marché, les paramètres fixes peuvent entraîner une instabilité de l'efficacité de la stratégie.
Orientation de l'optimisation de la stratégie
- Introduction du filtrage des fréquences d'oscillation: il est recommandé d'ajouter des indicateurs de fréquences d'oscillation tels que l'ATR ou la bande de Brindé pour filtrer les faux signaux dans des environnements à basse fréquence.
- Ajout d'une confirmation de la quantité de transaction: la combinaison d'un indicateur de la quantité de transaction peut améliorer la fiabilité du signal.
- Optimisation des mécanismes d'arrêt des pertes: il est recommandé d'ajouter des fonctions d'arrêt dynamiques, telles que le suivi des pertes ou les paramètres d'arrêt des pertes basés sur l'ATR.
- Augmentation de la classification des environnements de marché: les paramètres de stratégie peuvent être dynamiquement ajustés en fonction des différents environnements de marché (trends / chocs).
- Ajout d'un module de contrôle des risques: il est recommandé d'ajouter des fonctions de gestion des positions et de contrôle des risques.
Résumer
Cette stratégie, combinée au MACD et aux EMA pluricycliques, permet de construire un système de négociation plus complet. L'avantage du système réside dans la clarté des signaux, la richesse de l'analyse et une bonne visualisation. Mais il existe également des risques inhérents tels que le retard et les faux signaux.
- 1