Stratégie de trading dynamique basée sur le Z-score et la supertrend : système de commutation long-short

Aperçu
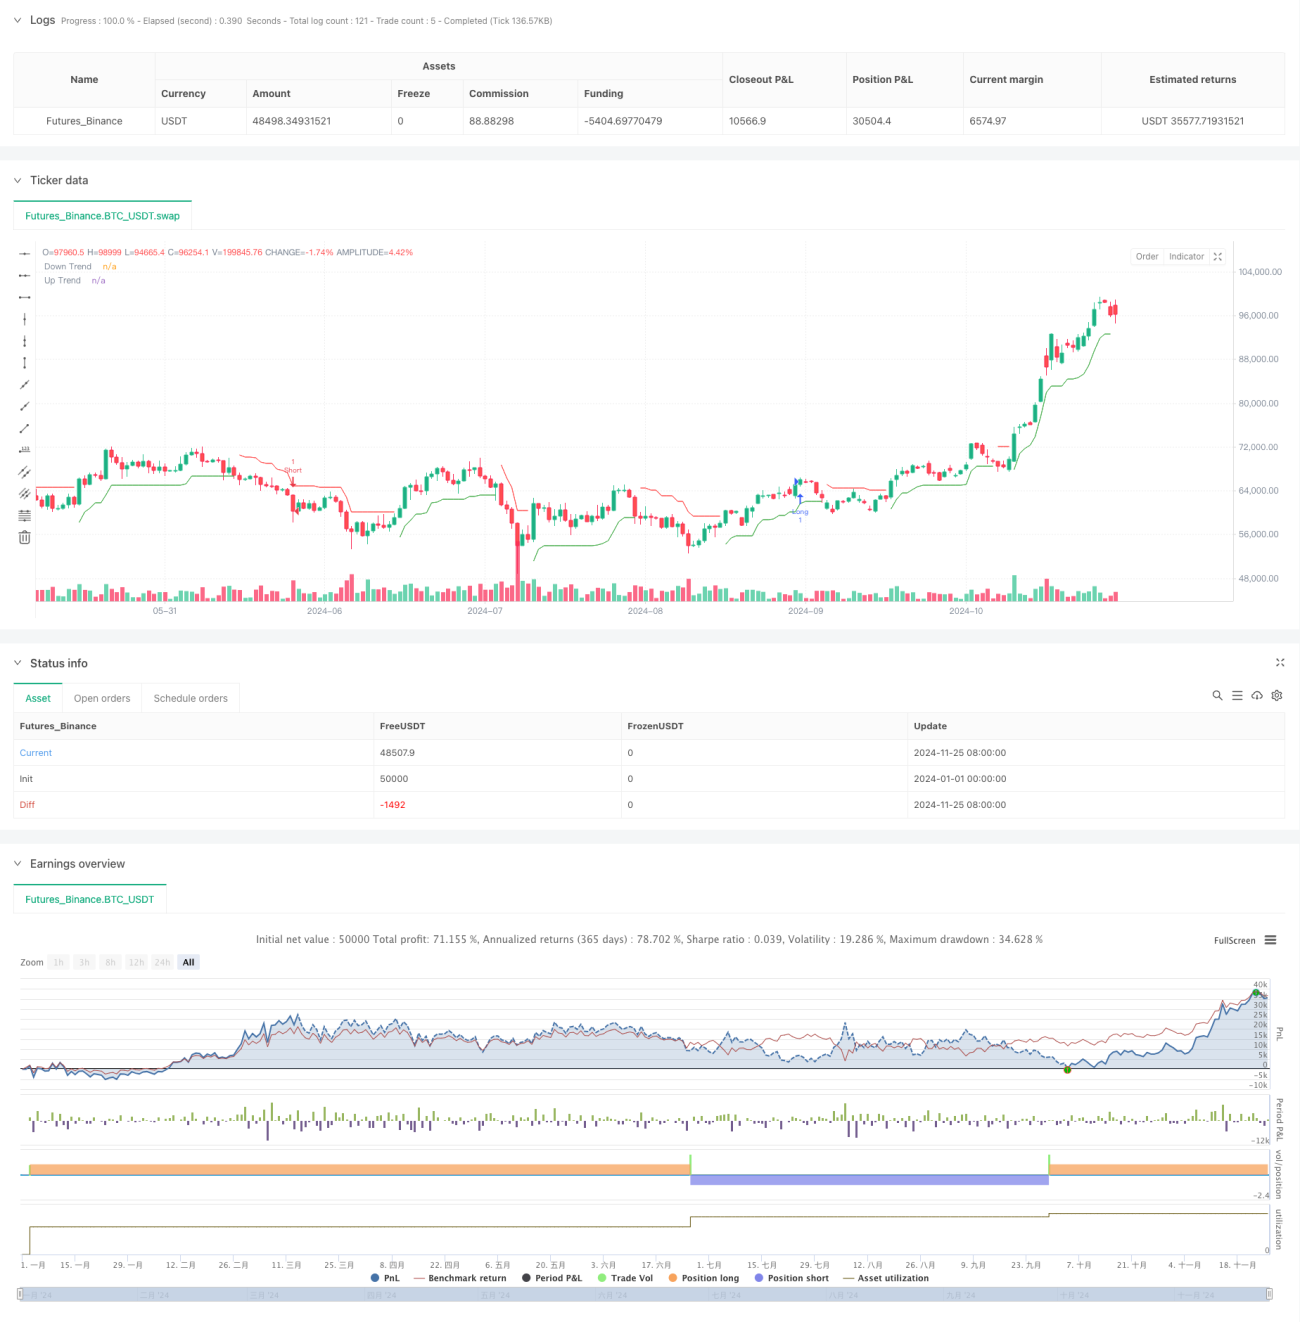
Cette stratégie est un système de trading quantitatif qui combine une méthode statistique de Z-Score, un indicateur relativement fort (RSI) et un indicateur de Supertrend (Supertrend). La stratégie cherche des opportunités de trading à haute probabilité sur le marché en surveillant l'écart statistique des prix, en combinant les indicateurs de dynamique et la confirmation de la tendance.
Principe de stratégie
La logique centrale de la stratégie est basée sur la synergie de trois principaux indicateurs techniques: d'abord, la mesure de l'écart du prix actuel par rapport à la moyenne historique par le calcul d'un Z-score, qui utilise une moyenne mobile et un écart-type de 75 cycles. Lorsque le Z-score est supérieur à 1,1 ou inférieur à -1,1, il indique un écart statistique significatif.
Avantages stratégiques
- Confirmation de signaux multiples: amélioration de la fiabilité des signaux de trading en combinant les trois dimensions de l'indicateur: statistique, dynamique et tendance.
- Adaptabilité: la méthode de calcul du score Z permet à la stratégie de s'adapter à différents environnements de marché sans être affectée par le niveau de prix absolu.
- Contrôle des risques amélioré: l'indicateur de tendance super offre un suivi automatique des tendances et un mécanisme de contrôle des risques.
- La stratégie permet de saisir les opportunités dans les deux sens de l'espace libre, ce qui améliore l'efficacité de l'utilisation des fonds.
- Signal clair: la stratégie utilise des modèles mathématiques clairs et des indicateurs objectifs, évitant ainsi les jugements subjectifs.
Risque stratégique
- Risque de retard: la stratégie peut être en retard de signal dans un marché en évolution rapide en raison de l'utilisation de moyennes mobiles sur plusieurs cycles.
- Risque de fausse rupture: Il est possible que des signaux de fausse rupture se produisent fréquemment sur les marchés de gré à gré.
- Sensitivité des paramètres: l'efficacité de la stratégie dépend fortement du choix des paramètres, différents paramètres peuvent être nécessaires dans différents environnements de marché.
- La dépendance aux conditions du marché: dans les marchés où la tendance n'est pas évidente, la performance de la stratégie peut ne pas être optimale.
Orientation de l'optimisation de la stratégie
- Ajustement dynamique des paramètres: un mécanisme d'adaptation des paramètres peut être introduit pour ajuster automatiquement les paramètres de la baisse du Z-score et de la tendance à la hausse en fonction de la volatilité du marché.
- Ajout d'un filtre d'environnement de marché: ajout d'un module d'identification d'environnement de marché qui utilise une combinaison de paramètres différente dans différentes conditions de marché.
- Amélioration des mécanismes d'arrêt des pertes: introduction de stratégies d'arrêt dynamiques, telles que l'arrêt basé sur l'ATR ou le suivi des pertes.
- Filtrage optimisé des signaux: vous pouvez ajouter la confirmation de transaction ou d'autres indicateurs techniques pour filtrer davantage les signaux de transaction.
- Introduction du filtrage temporel: envisagez d'augmenter la limite de la fenêtre de temps de négociation pour éviter les périodes de plus grande volatilité.
Résumer
Il s'agit d'une stratégie de négociation quantitative qui combine méthodes statistiques et d'analyse technique pour améliorer la fiabilité des transactions grâce à la confirmation de signaux multiples. Les principaux avantages de la stratégie résident dans ses modèles mathématiques objectifs et ses mécanismes de contrôle des risques, mais il faut également prêter attention à l'optimisation des paramètres et à la question de l'adaptabilité du marché.
- 1