
Aperçu
La stratégie est un système de trading quantitatif combinant les bandes de Bollinger, les indices de force relative (RSI) et les moyennes de coût dynamiques (DCA). La stratégie impose des règles de gestion de fonds, exécute automatiquement des opérations de construction de position en lots dans les fluctuations du marché, tout en combinant des indicateurs techniques pour juger des signaux d'achat et de vente, et exécute des transactions à risque contrôlable. Le système contient également une logique de stop-loss et un suivi des bénéfices cumulés, permettant de surveiller et de gérer efficacement la performance des transactions.
Principe de stratégie
La stratégie repose principalement sur les éléments fondamentaux suivants :
- L'indicateur de la ceinture de Brin est utilisé pour juger de la zone de fluctuation des prix, en considérant l'achat lorsque le prix touche le bas et la vente lorsque le prix touche le haut
- L'indicateur RSI est utilisé pour confirmer un état de survente du marché. Le RSI est confirmé en survente lorsque le RSI est inférieur à 25 et confirmé en survente lorsqu'il est supérieur à 75
- Le module DCA calcule le montant de chaque placement en fonction de la dynamique des intérêts du compte et permet une gestion adaptative des fonds
- Le module de stop-loss fixe un objectif de profit de 5% pour atteindre l'objectif.
- Le module de surveillance de l'état du marché calcule l'ampleur des variations du marché sur 90 jours pour aider à déterminer les tendances globales
- Le module de suivi des bénéfices cumulés enregistre les pertes et les pertes de chaque transaction afin d'évaluer la performance de la stratégie
Avantages stratégiques
- Amélioration de la fiabilité du signal combinée à une vérification croisée de multiples indicateurs techniques
- Gestion dynamique des positions pour éviter les risques liés aux positions fixes
- La mise en place de conditions de stop-loss raisonnables et le verrouillage des bénéfices en temps opportun
- Une fonctionnalité de surveillance des tendances du marché pour mieux comprendre le contexte
- Un système de suivi des bénéfices parfait pour analyser la performance de la stratégie
- Alerte en temps réel sur les opportunités de trading
Risque stratégique
- La volatilité des marchés pourrait souvent déclencher des signaux conduisant à une augmentation des coûts de transaction.
- L'indicateur RSI pourrait être en retard sur un marché en tendance
- Le taux fixe d'arrêt pourrait être abandonné trop tôt dans un marché en forte tendance
- La stratégie de la DCA pourrait entraîner un retrait plus important dans un marché en baisse unilatérale
Les mesures suivantes sont recommandées pour gérer les risques :
- Définition de la limite de position maximale
- Paramètres adaptés à la dynamique des fluctuations du marché
- Ajouter un filtre de tendance
- Mise en œuvre d'une stratégie de blocage par paliers
Orientation de l'optimisation de la stratégie
- Optimisation dynamique des paramètres :
- Les paramètres de la bande de Bryn peuvent être ajustés en fonction des fluctuations
- La marge RSI peut varier selon le cycle du marché
- Le pourcentage de fonds DCA peut être ajusté en fonction de la taille du compte
- Le système de signalisation est renforcé:
- Confirmation d'augmentation du volume
- Ajout d'une analyse de ligne de tendance
- La vérification croisée des indicateurs techniques
- Le risque est bien maîtrisé:
- Réalisation d'un arrêt de perte dynamique
- Ajout de contrôle de rétractation maximale
- Limite de perte par jour
Résumer
La stratégie utilise une approche intégrée de l'analyse technique et de la gestion des fonds pour construire un système de négociation relativement complet. L'avantage de la stratégie réside dans la reconnaissance de signaux multiples et une bonne gestion des risques, mais elle nécessite toujours un test et une optimisation approfondis sur le marché.
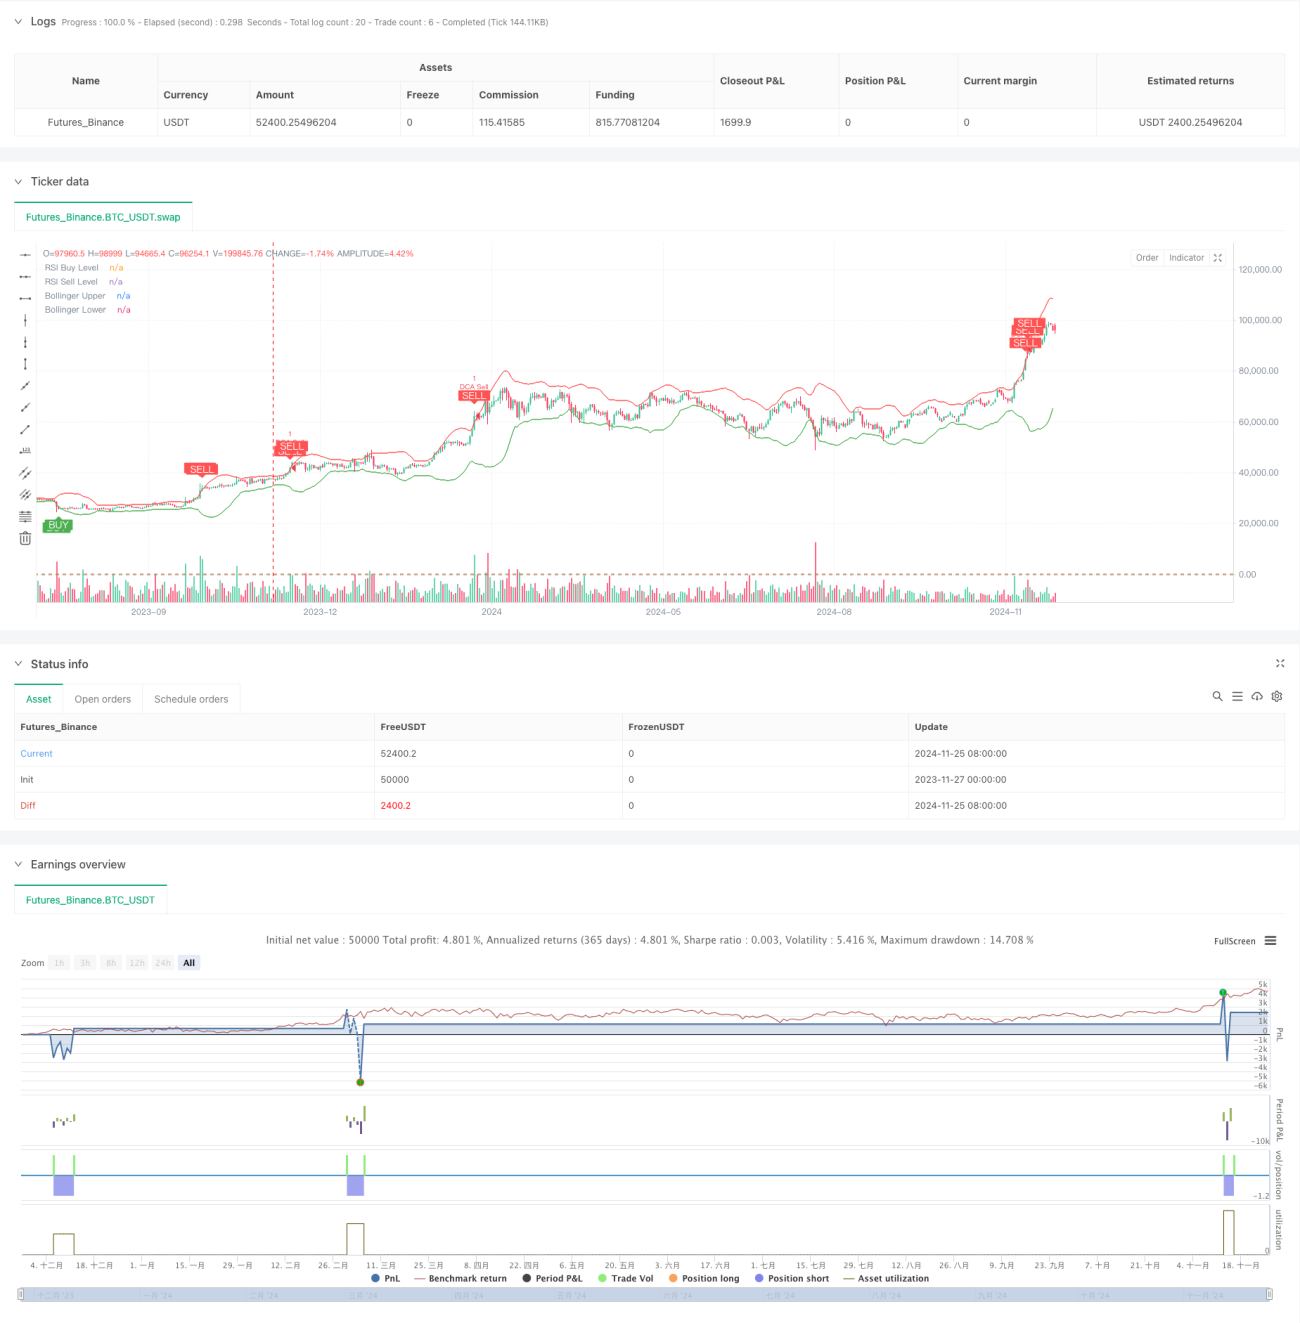
/*backtest
start: 2023-11-27 00:00:00
end: 2024-11-26 00:00:00
period: 1d
basePeriod: 1d
exchanges: [{"eid":"Futures_Binance","currency":"BTC_USDT"}]
*/

//@version=5
strategy("Combined BB RSI with Cumulative Profit, Market Change, and Futures Strategy (DCA)", shorttitle="BB RSI Combined DCA Strategy", overlay=true)

// Input Parameters- 1