Suivi des tendances sur plusieurs périodes et stratégie de gestion de la volatilité ATR

Aperçu
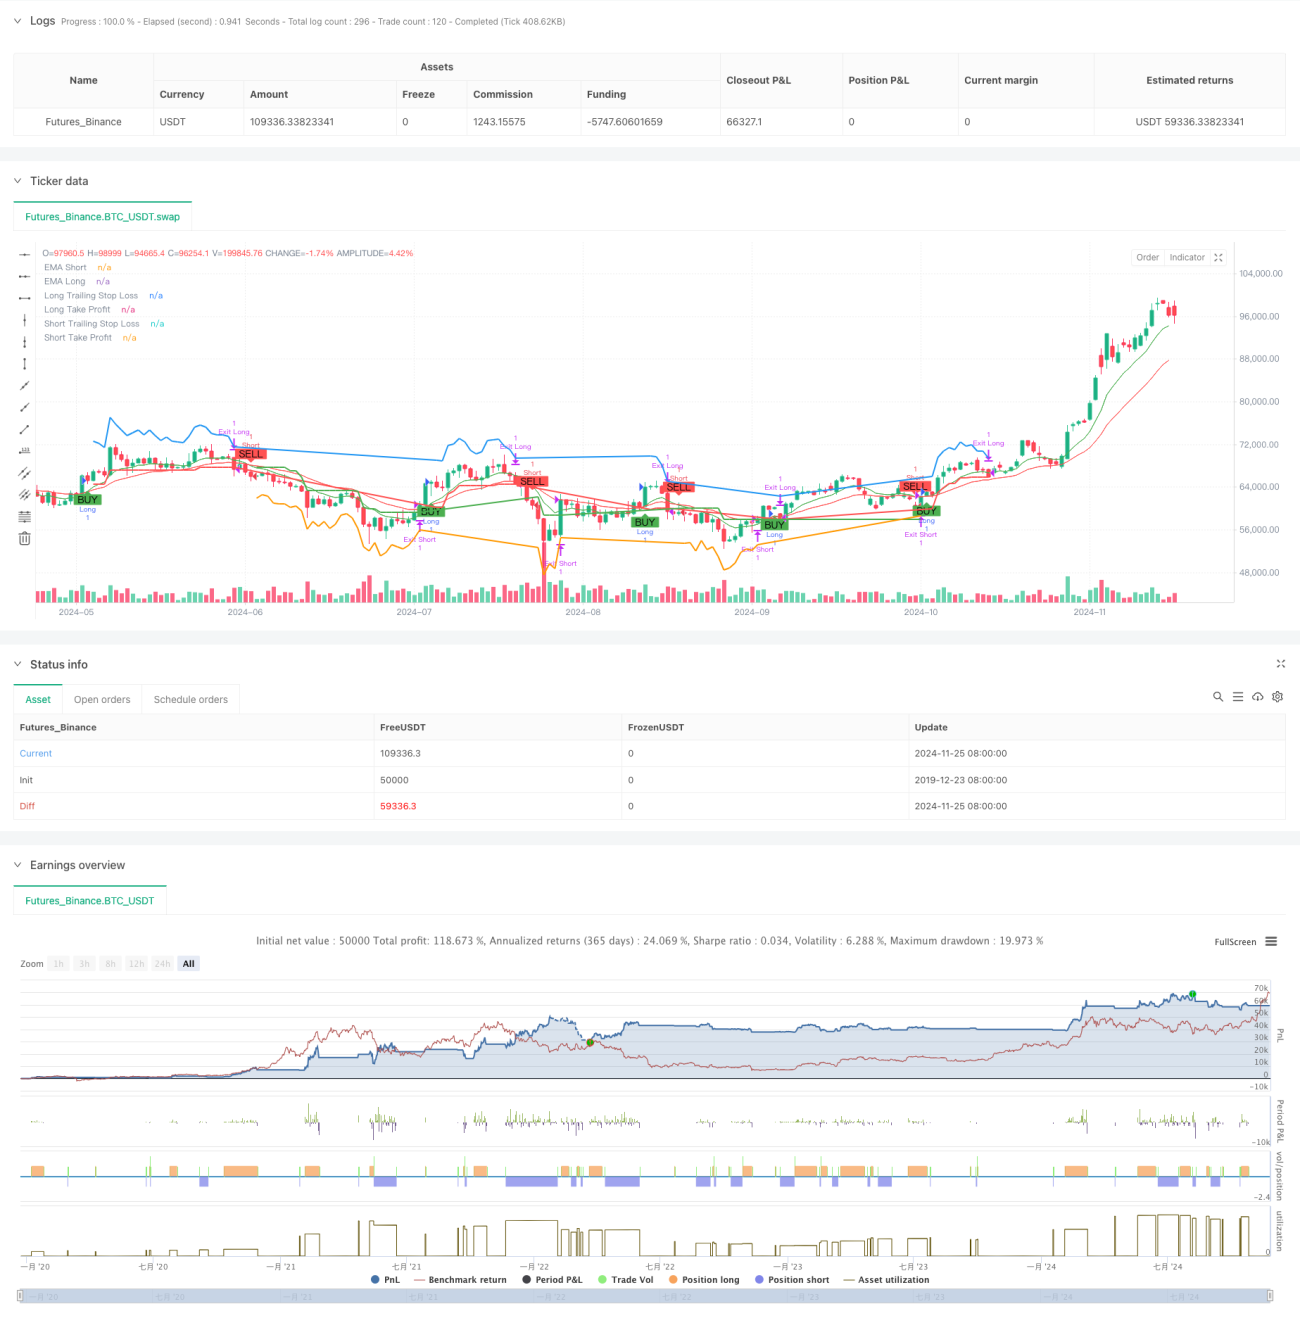
Il s'agit d'une stratégie de suivi de tendance combinant l'analyse multi-cycle et la gestion de la volatilité. Le cœur de la stratégie utilise la direction de la tendance jugée par un croisement bi-équivalent, un filtre sur-achat et sur-vente par l'indicateur RSI, l'introduction d'une période de temps plus élevée. L'EMA confirme la tendance globale et utilise l'indicateur ATR pour gérer dynamiquement les arrêts et les objectifs de profit.
Principe de stratégie
La logique de transaction centrale de la stratégie est divisée en plusieurs parties clés:
- Identification de la tendance: utilisation d'un croisement des EMA à courte et longue période pour identifier les changements de tendance, générant un signal de multiplication lorsque l'EMA à court terme est portée par l'EMA à long terme et un signal de blanchiment lorsque l'EMA est portée par le bas.
- Confirmation de tendance: introduire des EMA de périodes plus élevées comme filtre de tendance, ne permettant de faire plus que lorsque le prix est au-dessus des EMA de périodes élevées, et vice versa.
- Filtre de volatilité: utilisez le RSI pour juger si vous êtes en sur-achat ou en sur-vente, afin d'éviter d'entrer dans le marché en cas d'un suivi excessif de la baisse.
- Gestion des positions: paramétrage dynamique des objectifs de stop loss et de profit basé sur l'ATR, ajustement automatique des positions de stop loss en fonction de la variation des prix, protection des gains et des pertes.
- La protection multidimensionnelle: stratégie de construction d'un système de décision de transaction complet par l'utilisation intégrée de plusieurs indicateurs techniques.
Avantages stratégiques
- Haute fiabilité des signaux: la fiabilité des signaux de négociation a été considérablement améliorée grâce à l'utilisation conjointe de multiples indicateurs techniques.
- Contrôle des risques: un système de stop-loss dynamique basé sur l'ATR, permettant d'adapter la position de stop-loss en fonction de la volatilité du marché.
- Prise en compte des tendances: l'utilisation d'une méthode d'analyse à cycles multiples améliore la précision de jugement des principales tendances.
- Objectifs de profit flexibles: la configuration take-profit est également basée sur l'ajustement dynamique de l'ATR, sans quitter le terrain trop tôt tout en garantissant un profit.
- Adaptabilité: les paramètres de la stratégie sont adaptables et peuvent s'adapter à différents environnements de marché.
Risque stratégique
- Risque de choc: les transactions fréquentes peuvent entraîner des pertes en cas de choc horizontal.
- Risque de glissement: les prix de transaction réels peuvent être très éloignés des prix théoriques en période de forte volatilité.
- Risque de fausse percée: il est possible qu'une reprise se produise après une percée de courte durée, ce qui entraîne un arrêt des pertes.
- Sensitivité des paramètres: les différentes combinaisons de paramètres ont un impact important sur la performance de la stratégie et doivent être testées de manière adéquate.
Orientation de l'optimisation de la stratégie
- Identification de l'environnement du marché: vous pouvez ajouter des indicateurs de force de tendance, réduire automatiquement les positions ou suspendre les transactions en cas de choc du marché.
- Optimisation du temps d'entrée: les indicateurs de trafic peuvent être combinés pour améliorer la fiabilité du signal d'entrée.
- Ajustement des paramètres dynamiques: les cycles EMA et les multiples ATR peuvent être ajustés automatiquement en fonction des fluctuations du marché.
- Le système de stockage en lots: il est possible de concevoir des mécanismes de stockage et de déstockage en lots pour réduire le risque d'un seul point de prix.
- Optimisation de la gestion des positions: la taille des positions peut être ajustée en fonction du risque du compte et de la dynamique de la volatilité du marché.
Résumer
Il s'agit d'une stratégie de suivi de tendance bien conçue, qui permet de mieux réaliser les caractéristiques de risque-rendement grâce à l'analyse multicyclique et à la gestion de la volatilité. L'avantage central de la stratégie réside dans la combinaison organique de plusieurs indicateurs techniques, qui garantit à la fois la fiabilité des transactions et la maîtrise efficace des risques. Bien qu'il existe des risques potentiels, la performance globale de la stratégie peut être améliorée par une optimisation et une amélioration continues.
- 1