Système avancé de trading de suivi de tendance de momentum à moyenne mobile double

La stratégie est basée sur un système de suivi de tendance dynamique basé sur un système bi-médian, combinant des signaux croisés de médian rapide et de médian lent, tout en introduisant des médianes filtrées pour optimiser le timing d'entrée en jeu et pour obtenir des résultats de trading robustes grâce à la gestion des fonds et à la maîtrise des risques.
Principe de stratégie
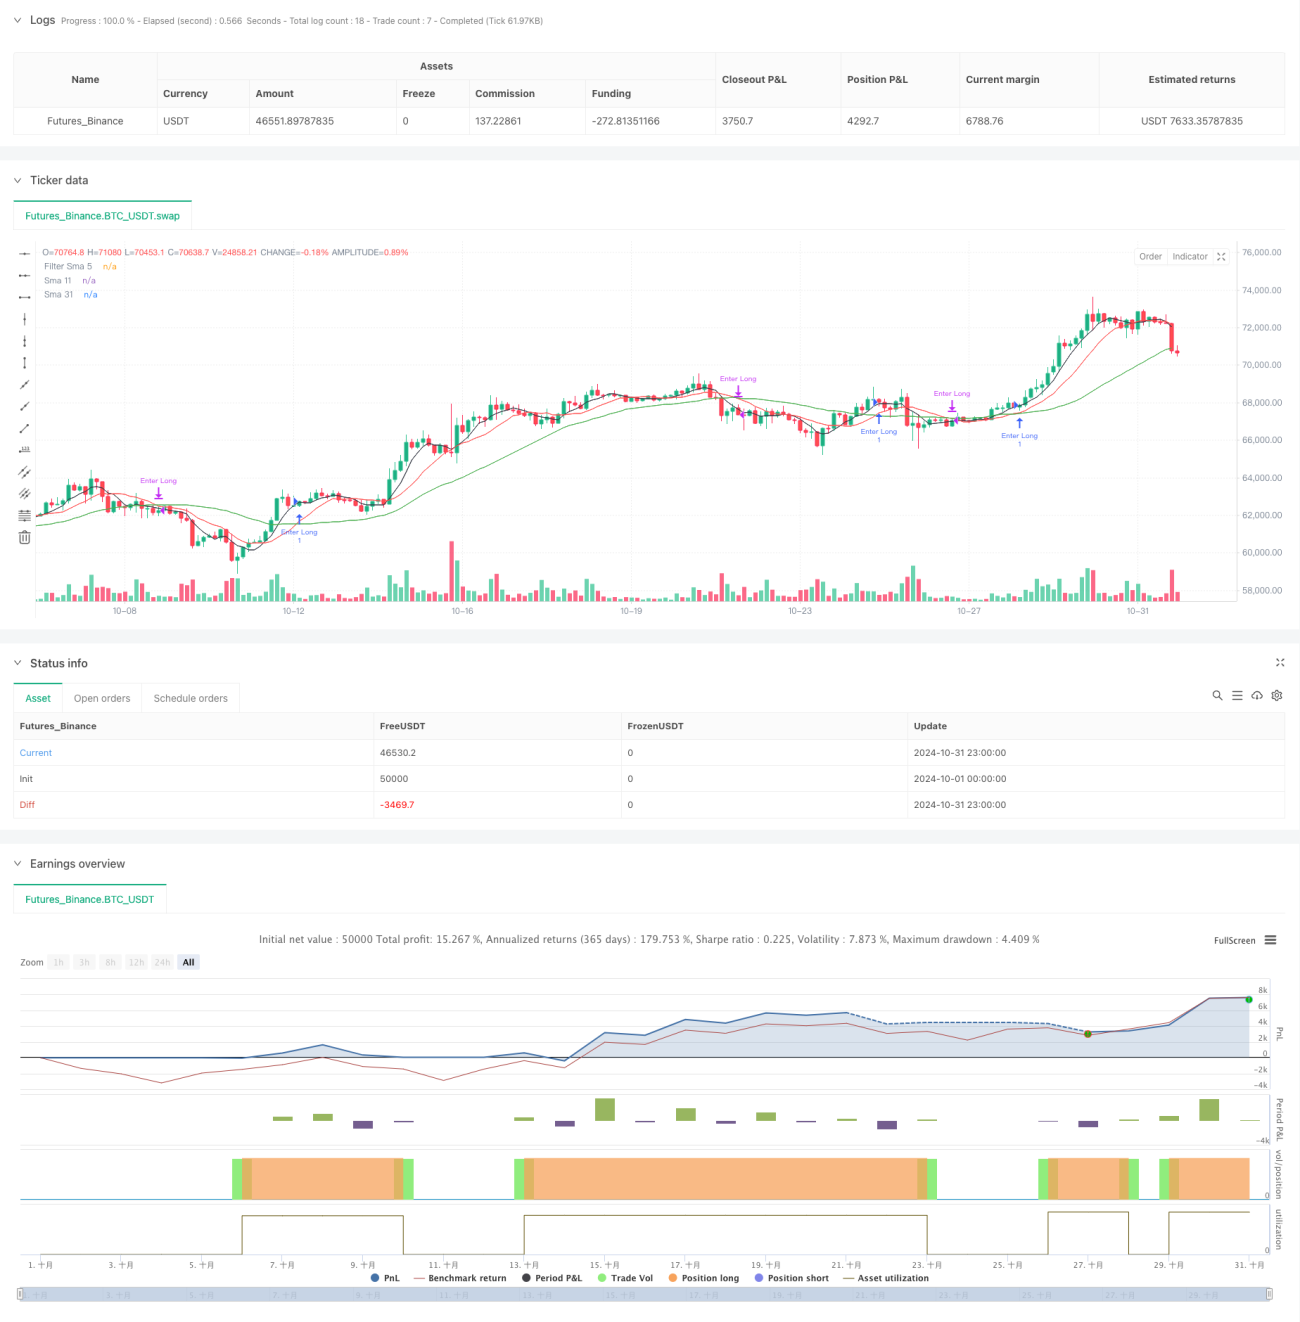
La stratégie utilise la moyenne mobile simple à 11 et 31 cycles (SMA) comme système de signaux principal, tout en utilisant la moyenne moyenne à 5 cycles comme filtre. Lorsque la ligne rapide (SMA11) traverse la ligne lente (SMA31) et que le prix est au-dessus de la ligne moyenne filtrée, le système génère plusieurs signaux.
Avantages stratégiques
- Le système de signalisation est simple et clair, facile à comprendre et à mettre en œuvre
- La confirmation de la moyenne multiple permet de filtrer efficacement les fausses données
- Le risque est maîtrisé avec des montants fixes
- Une bonne capacité de suivi des tendances
- La logique d'entrée et de sortie est claire, les hésitations ne se produisent pas facilement.
- Adaptation à des environnements de marché différents
Risque stratégique
- Les marchés en crise peuvent générer des transactions fréquentes
- Il y a un certain retard dans le système linéaire.
- Les transactions à capital fixe peuvent ne pas être pleinement rentables
- Les fluctuations du marché ne sont pas prises en compte.
- Le manque de mécanismes de freinage des pertes pourrait augmenter le risque de retrait
Orientation de l'optimisation de la stratégie
- Introduction d'un cycle de moyenne linéaire adaptatif qui s'adapte dynamiquement aux fluctuations du marché
- Augmentation des filtres de volatilité pour ajuster la position dans un environnement à forte volatilité
- Concevoir des systèmes de gestion de fonds dynamiques pour améliorer l'efficacité de l'utilisation des fonds
- Adhésion à des mécanismes de stop-loss et de stop-loss pour contrôler le risque d'une seule transaction
- Considérer l'introduction d'indicateurs de force de tendance et optimiser le moment d'entrée
- Augmenter le filtrage des heures de transaction pour éviter de négocier à des moments défavorables
Résumer
La stratégie a construit un système de suivi de tendance relativement stable grâce à un système de multiples équilibrages. Bien qu'il existe des limites inhérentes, la stabilité et la rentabilité de la stratégie peuvent être encore améliorées par des optimisations et des améliorations raisonnables. Il est recommandé aux traders d'ajuster les paramètres de manière ciblée en fonction des conditions spécifiques du marché lors de leur application en direct.
- 1