Stratégie de trading quantitative de suivi des tendances de la moyenne mobile T3 et de stop loss mobile

Aperçu
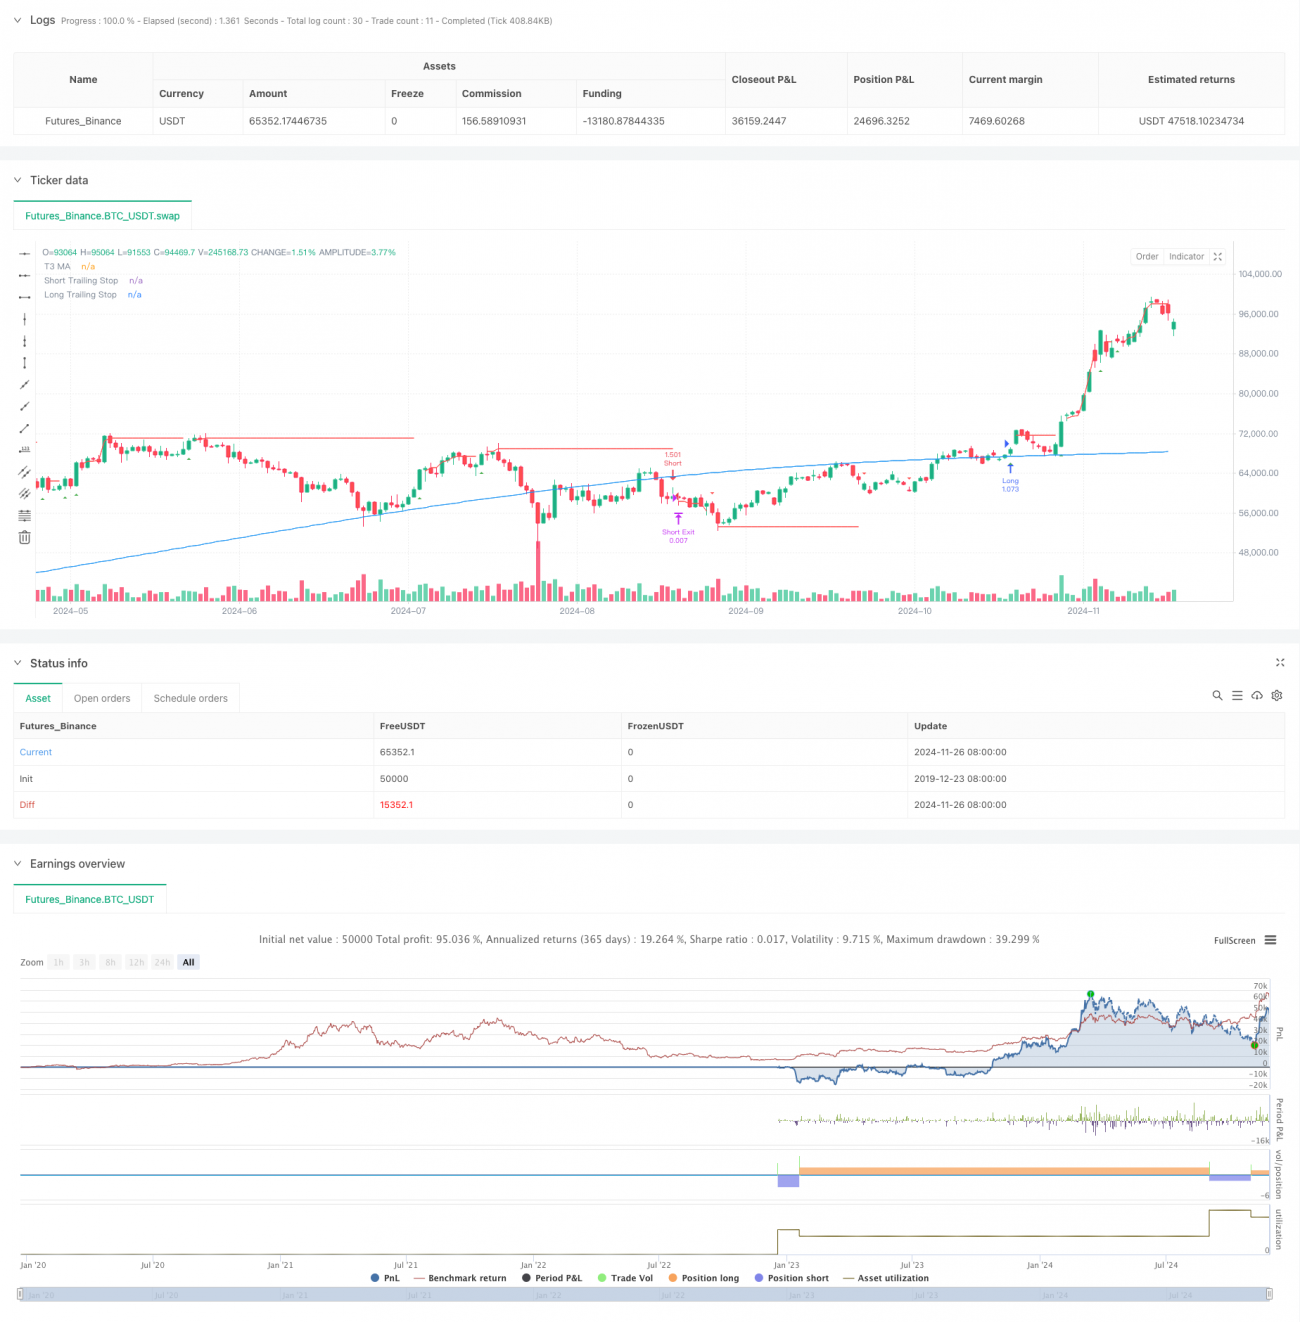
Cette stratégie est un système de trading quantitatif intégré combinant la moyenne T3, le suivi des tendances et le stop-loss mobile. La stratégie identifie la direction de la tendance du marché à l'aide de la moyenne mobile T3, tout en utilisant l'indicateur de tendance Lemon et l'indicateur TDFI pour la confirmation du signal.
Principe de stratégie
Le cœur de la stratégie comprend trois parties principales: l'identification de la tendance, la confirmation du signal et la gestion du risque. Premièrement, l'utilisation de la moyenne mobile T3 comme principal outil d'identification de la tendance, la moyenne T3 par le calcul de la moyenne mobile de l'indice hexagonal, permet de réduire efficacement le retard et de maintenir la fluidité. Deuxièmement, la zone d'oscillation des prix est calculée à l'aide de l'indicateur de tendance Lemon, le signal est filtré en combinaison avec l'indicateur TDFI, et le signal de transaction n'est généré que lorsque le prix franchit la zone d'oscillation et que l'indicateur TDFI est confirmé.
Avantages stratégiques
- Le mécanisme de confirmation de signaux multiples améliore la précision des transactions
- L'utilisation d'une ligne moyenne T3 réduit l'effet de fausse percée
- Un système de gestion des risques souple, qui permet de laisser suffisamment de place aux tendances tout en protégeant les profits
- La suspension partielle de la position est soutenue, permettant un encaissement progressif des bénéfices.
- Les paramètres sont réglables et facilement optimisés en fonction des différentes conditions du marché
Risque stratégique
- Le calcul de la moyenne T3 est complexe et peut être retardé.
- La confirmation de signaux multiples peut entraîner des opportunités de trading manquées
- Le stop mobile peut être déclenché prématurément lors d'une forte volatilité
- Il faut une plus grande fluctuation des prix pour générer un signal efficace.
- Les faux signaux peuvent être fréquents sur le marché horizontal
Orientation de l'optimisation de la stratégie
- Introduction d'un indicateur de volatilité qui modifie le paramètre de stop-loss mobile
- Ajout d'un module de reconnaissance des environnements de marché, utilisant différents paramètres dans différentes conditions de marché
- Optimiser le cycle de calcul des indicateurs TDFI et améliorer la rapidité des signaux
- Considérer l'ajout d'un facteur de transfert pour la confirmation du signal
- Une étude sur les mécanismes de réglage des proportions d'arrêt partiel auto-adaptatif
Résumer
Il s'agit d'une stratégie de suivi de tendance complète conçue pour garantir la fiabilité des signaux de négociation tout en permettant une gestion efficace des risques grâce à l'utilisation conjointe de multiples indicateurs techniques. La conception modulaire de la stratégie lui donne une bonne extensibilité et un espace d'optimisation, ce qui en fait le cadre de base d'un système de suivi de tendance à moyen et long terme.
/*backtest
start: 2019-12-23 08:00:00
end: 2024-11-27 00:00:00
period: 1d
basePeriod: 1d
exchanges: [{"eid":"Futures_Binance","currency":"BTC_USDT"}]
*/

//@version=5
strategy("Lemon Trend Strategy", overlay=true, initial_capital=10000, default_qty_type=strategy.percent_of_equity, default_qty_value=100)

// Input parameters- 1