
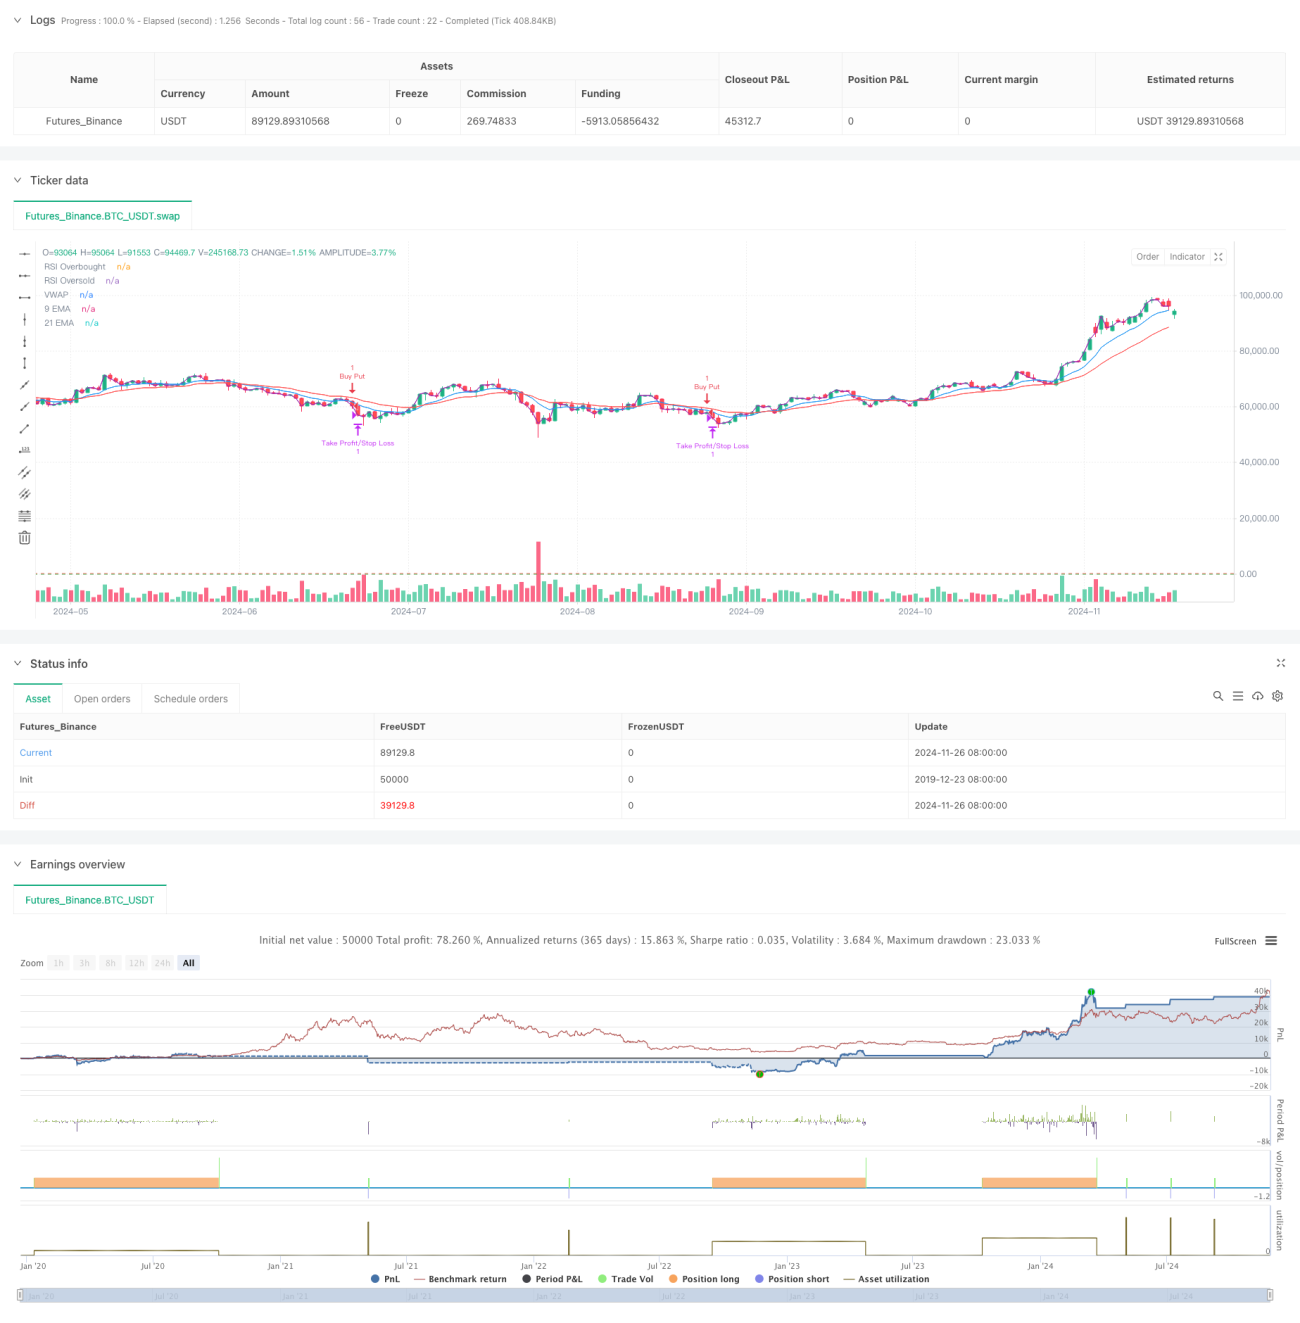
Aperçu
La stratégie est un système de trading à haute fréquence basé sur plusieurs indicateurs techniques, avec un délai de 5 minutes, combiné à un système linéaire, à des indicateurs dynamiques et à une analyse du volume de transactions. La stratégie s'adapte aux fluctuations du marché par un ajustement dynamique, en utilisant la confirmation de plusieurs signaux pour améliorer la précision et la fiabilité des transactions.
Principe de stratégie
La stratégie utilise le système bi-médian ((9 cycles et 21 cycles EMA) comme principal outil de détermination des tendances et confirme la dynamique en combinaison avec l'indicateur RSI. Lorsque le prix est au-dessus du bi-médian et que le RSI se situe dans la zone 40-65, le système recherche des opportunités de trading plus élevées; lorsque le prix est au-dessous du bi-médian et que le RSI se situe dans la zone 35-60, le système recherche des opportunités de trading à vide.
Avantages stratégiques
- Le mécanisme de confirmation de signaux multiples améliore considérablement la fiabilité des transactions
- Les paramètres de stop-loss dynamiques s'adaptent à différents environnements de marché
- Utilisez des seuils RSI plus conservateurs pour éviter de négocier dans des zones extrêmes
- Le mécanisme de confirmation de livraison filtre efficacement les faux signaux
- L'utilisation de VWAP aide à s'assurer que les transactions sont alignées avec les fonds traditionnels.
- Un système homogène de réponse rapide est parfait pour saisir les opportunités de marché à court terme.
Risque stratégique
- Les faux signaux peuvent être fréquents dans les marchés à basse volatilité
- Les restrictions sur les conditions multiples peuvent entraîner la perte de certaines opportunités de négociation
- Les transactions à haute fréquence peuvent avoir des coûts plus élevés
- Peut-être plus lent à réagir aux changements rapides du marché
- Une plus grande exigence en temps réel pour les données de marché
Orientation de l'optimisation de la stratégie
- Introduction d'un mécanisme d'ajustement des paramètres adaptatif permettant à la stratégie d'ajuster les paramètres de l'indicateur en fonction de la dynamique du marché
- Ajout d'un module de reconnaissance des environnements de marché pour adopter différentes stratégies de négociation dans différentes conditions de marché
- Optimiser les conditions de filtrage de la quantité de transaction, en envisageant d'utiliser la quantité de transaction relative ou l'analyse de la taille de la transaction
- Amélioration des mécanismes d'arrêt des pertes, avec possibilité d'ajouter une fonction de suivi des pertes
- Augmentation du filtrage des heures de négociation pour éviter les périodes d'ouverture et de clôture plus volatiles
Résumer
La stratégie utilise une combinaison de multiples indicateurs techniques pour construire un système de négociation relativement complet. L'avantage de la stratégie réside dans son mécanisme de confirmation de signal multidimensionnel et sa méthode de contrôle des risques dynamiques. Bien que certains risques potentiels existent, la stratégie a une bonne valeur d'application grâce à une optimisation et une gestion des risques raisonnables.
- 1