
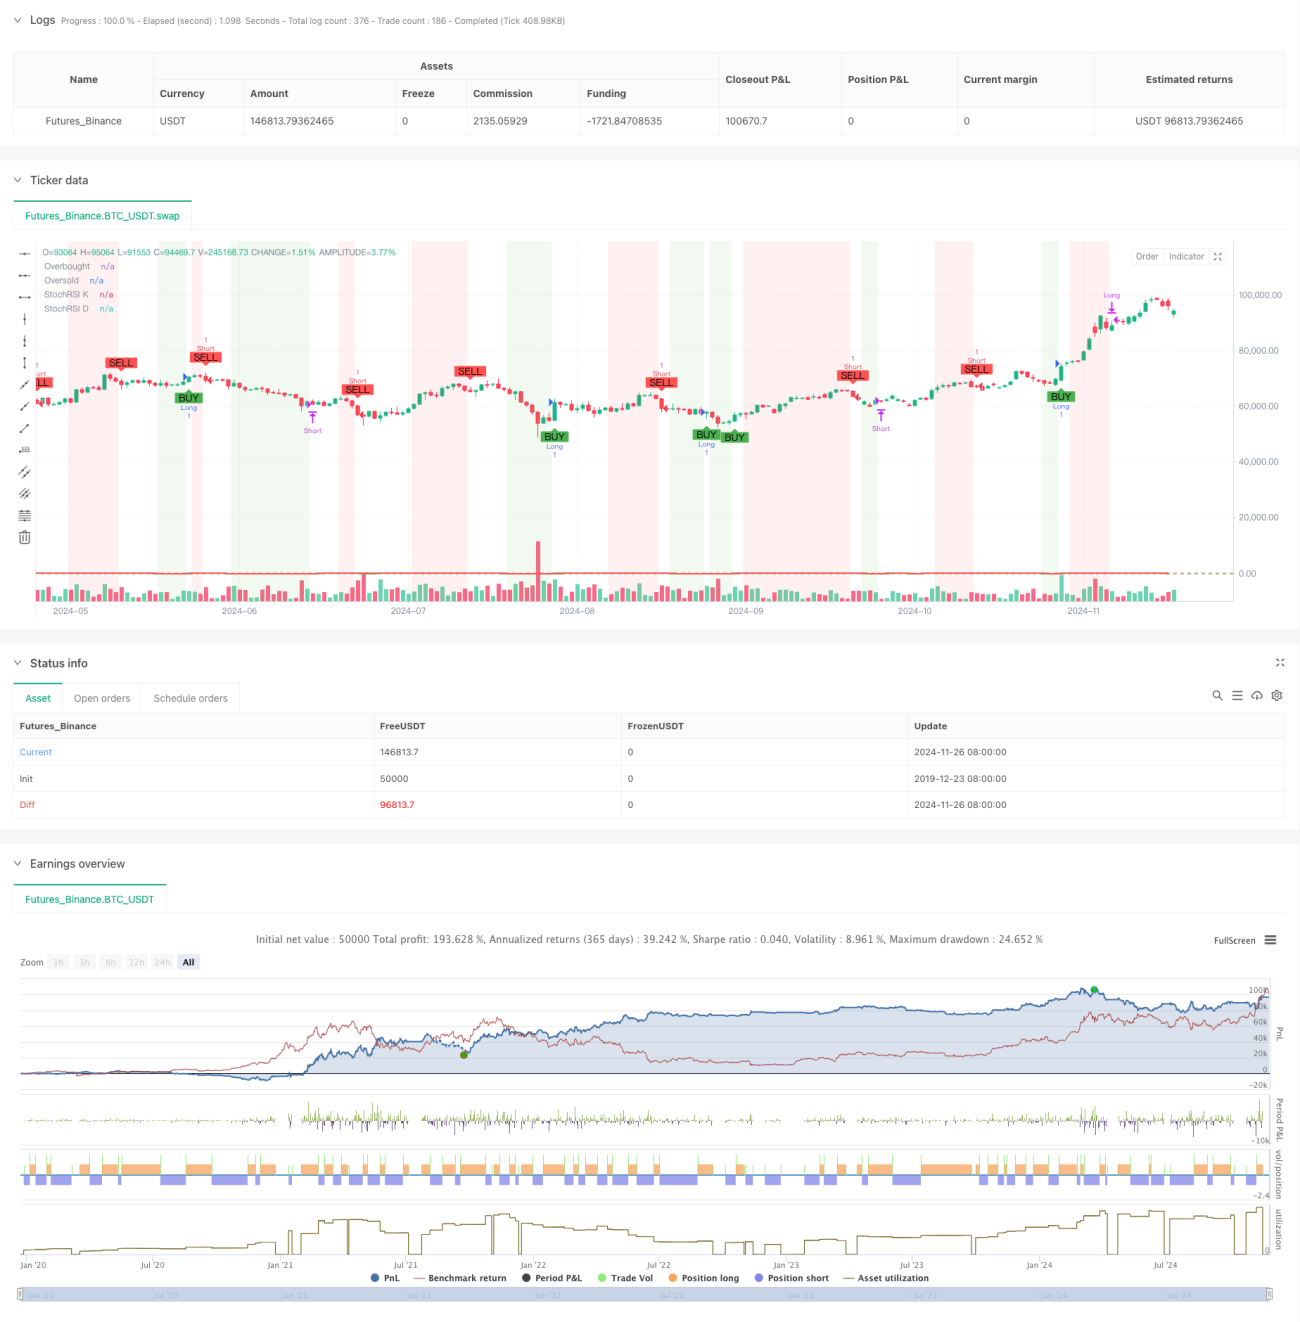
Aperçu
La stratégie est un système de trading complexe qui combine un indice stochastique relativement faible (RSI) et une forme de graphique. Le système analyse les niveaux de sur-achat et de survente de l'indicateur SRSI, la confirmation graphique de l'évolution des prix et la génération de signaux de négociation entièrement automatisés. La stratégie utilise une approche de combinaison d'indicateurs techniques avancées, intégrant les caractéristiques de suivi de la tendance et du trading inversé, avec une forte adaptabilité au marché.
Principe de stratégie
La logique fondamentale de la stratégie repose sur les éléments clés suivants :
- Utilisez le RSI à 14 cycles comme base pour calculer les valeurs aléatoires du RSI, qui forment la principale source de signal
- Configurer les lignes K et D du RSI au hasard comme des moyennes mobiles simples à 3 périodes pour un signal de lissage
- 80 et 20 sont définis comme des valeurs critiques de sur-achat et de sur-vente pour juger de l'état du marché
- Le rapport entre le prix d'ouverture et le prix de clôture du graphique actuel confirme la direction du marché
- Le signal de multiplication est déclenché lorsque la ligne K traverse le niveau de survente vers le haut et que la ligne Y apparaît.
- Un signal de vide est déclenché lorsque la ligne K descend et traverse le niveau de survente.
- Le stop loss est réalisé dans la direction correspondante lorsque la ligne K traverse le niveau de surachat et de survente respectivement
Avantages stratégiques
- Haute fiabilité des signaux: une précision significativement améliorée des signaux de négociation grâce à un mécanisme de double confirmation avec le RSI aléatoire et le graphe de pivot
- Contrôle des risques: des conditions de stop-loss claires permettent de contrôler efficacement le risque de chaque transaction
- Ajustabilité des paramètres: les paramètres clés peuvent être optimisés en fonction des caractéristiques du marché
- Retour visuel clair: utilisation de couleurs de fond et de balises graphiques pour afficher intuitivement les signaux de transaction
- Automatisation élevée: automatisation du processus de génération de signaux à l'exécution des commandes, avec une intervention humaine réduite
Risque stratégique
- Risque de choc: les faux signaux de rupture peuvent être fréquents dans les marchés à choc horizontal.
- Risque de retard: le calcul des moyennes mobiles présente un certain retard et peut manquer les meilleurs points d'entrée
- Sensitivité des paramètres: les paramètres différents affectent considérablement la performance de la stratégie et nécessitent une optimisation continue
- Dépendance aux conditions du marché: les signaux peuvent ne pas être suffisamment stables dans des conditions de marché très volatiles
- Risque systémique: les paramètres de stop-loss peuvent être désactivés en cas d'événement majeur sur le marché
Orientation de l'optimisation de la stratégie
- Introduction d'indicateurs de volume d'échange: une condition supplémentaire permettant d'augmenter le volume d'échange en tant que confirmation du signal
- Optimisation des mécanismes d'arrêt des pertes: l'utilisation d'un arrêt de suivi ou d'un arrêt dynamique ATR peut être envisagée
- Ajout de filtres de tendance: ajout d'une moyenne mobile à longue période comme filtre de tendance
- Amélioration du filtrage des signaux: prendre en compte les fluctuations du marché et ajuster les paramètres en cas de forte volatilité
- Ajustement des paramètres dynamiques: ajustement dynamique des seuils d'achat et de vente en fonction de l'état du marché
Résumer
La stratégie est construite en combinant des indicateurs RSI aléatoires et des diagrammes de couverture pour construire un système de négociation robuste. Le système est simple à utiliser et permet un meilleur contrôle du risque. La stratégie est adaptée à différents environnements de marché grâce à une optimisation des paramètres et un filtrage des signaux raisonnables.
- 1