Stratégie de suivi de tendance moyenne à double lissage - basée sur la ligne K améliorée de Ping An Jiang

1
Follow
1781
Followers
Aperçu
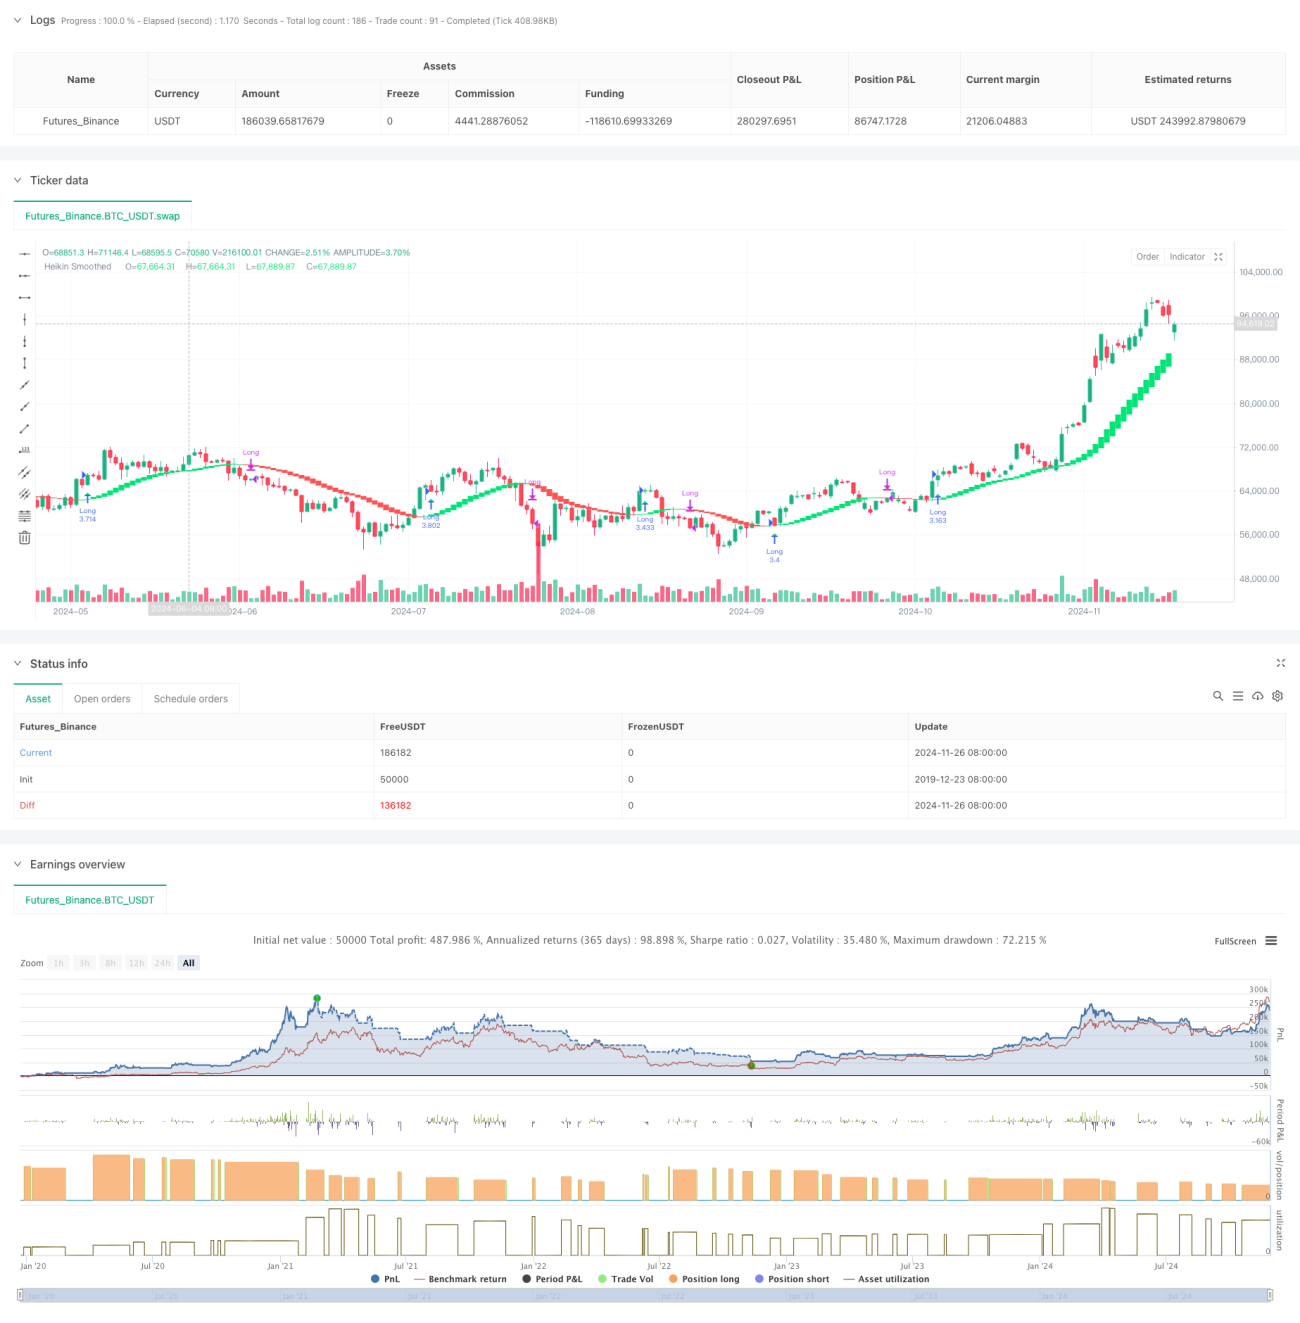
Cette stratégie est un système de suivi de tendance basé sur la ligne K de Heikin-Ashi. Elle réduit efficacement le bruit du marché et fournit un signal de tendance plus clair en appuyant sur la ligne K de Heikin-Ashi.
Principe de stratégie
La logique fondamentale de la stratégie comprend les étapes clés suivantes :
- Le premier traitement de l'EMA des données sur les prix des OHLC
- Ligne K améliorée de Pingjiang, utilisant le calcul des prix après lissage
- Une seconde EMA est effectuée sur la ligne K de Pingyang.
- Modification de la couleur de la ligne K en comparant le prix d'ouverture et le prix de clôture après lissage
- Le signal d'achat est généré par le rouge qui tourne vers le vert et le signal de vente est généré par le vert qui tourne vers le rouge.
- Opérer sur une position de 100% du montant total du compte
Avantages stratégiques
- Le double traitement de lissage réduit considérablement les fausses signaux
- Le simple fait d'avoir plusieurs stratégies réduit le risque de faillite
- La tendance est confirmée et les chances de victoire augmentent.
- Un système de signaux complet qui prend en charge les transactions automatisées
- Sélection de périodes de temps flexibles pour répondre à différentes exigences de transaction
- Des règles simples et claires pour faciliter l'entrée et la sortie
- Prise en charge de la gestion des fonds dans des conditions de marché différentes
Risque stratégique
- Un revirement de tendance pourrait entraîner un retrait plus important
- Des signaux de fausses alertes dans un marché en crise
- Le mode de négociation en position pleine augmente le risque de capital
- Le retard du signal d'entrée pourrait avoir manqué une partie de la hausse
- Les performances varient selon les périodes
Orientation de l'optimisation de la stratégie
- Introduction d'un filtre à intensité de tendance pour réduire les fausses signaux sur les marchés oscillante
- Augmentation de la gestion dynamique des portefeuilles et optimisation de l'utilisation des fonds
- Ajout d'une fonction de stop loss mobile pour contrôler le risque de retrait
- Confirmation de l'efficacité du signal en combinaison avec d'autres indicateurs techniques
- Développement d'un système de paramètres d'adaptation pour améliorer la stabilité stratégique
Résumer
La stratégie est conçue de manière concise, facile à comprendre et à exécuter, tout en offrant plusieurs directions d'optimisation pour s'adapter aux différents environnements de marché. Bien qu'il existe un certain risque de retard et de retrait, la stratégie est capable de fournir aux investisseurs un outil fiable de suivi des tendances grâce à une gestion rationnelle des fonds et à des mesures de contrôle des risques.
Source
Pine
/*backtest
start: 2019-12-23 08:00:00
end: 2024-11-27 08:00:00
period: 1d
basePeriod: 1d
exchanges: [{"eid":"Futures_Binance","currency":"BTC_USDT"}]
*/

//@version=5
strategy("Smoothed Heiken Ashi Strategy Long Only", overlay=true, initial_capital=1000, default_qty_type=strategy.percent_of_equity, default_qty_value=100)

len = input.int(10, title="EMA Length")Strategy parameters
Related strategies
Comment
All comments (0)
No data
- 1