
Aperçu
Cette stratégie est un système de trading quantitatif qui combine la croisée des moyennes mobiles et des indices relativement faibles (RSI) et intègre la fonction de suivi des pertes. La stratégie utilise deux moyennes mobiles de 9 cycles et 21 cycles comme indicateurs principaux de jugement de la tendance, en combinaison avec l'indicateur RSI pour la confirmation des signaux de négociation et pour protéger les bénéfices et contrôler les risques en suivant dynamiquement les pertes.
Principe de stratégie
La logique fondamentale de la stratégie repose sur les éléments clés suivants :
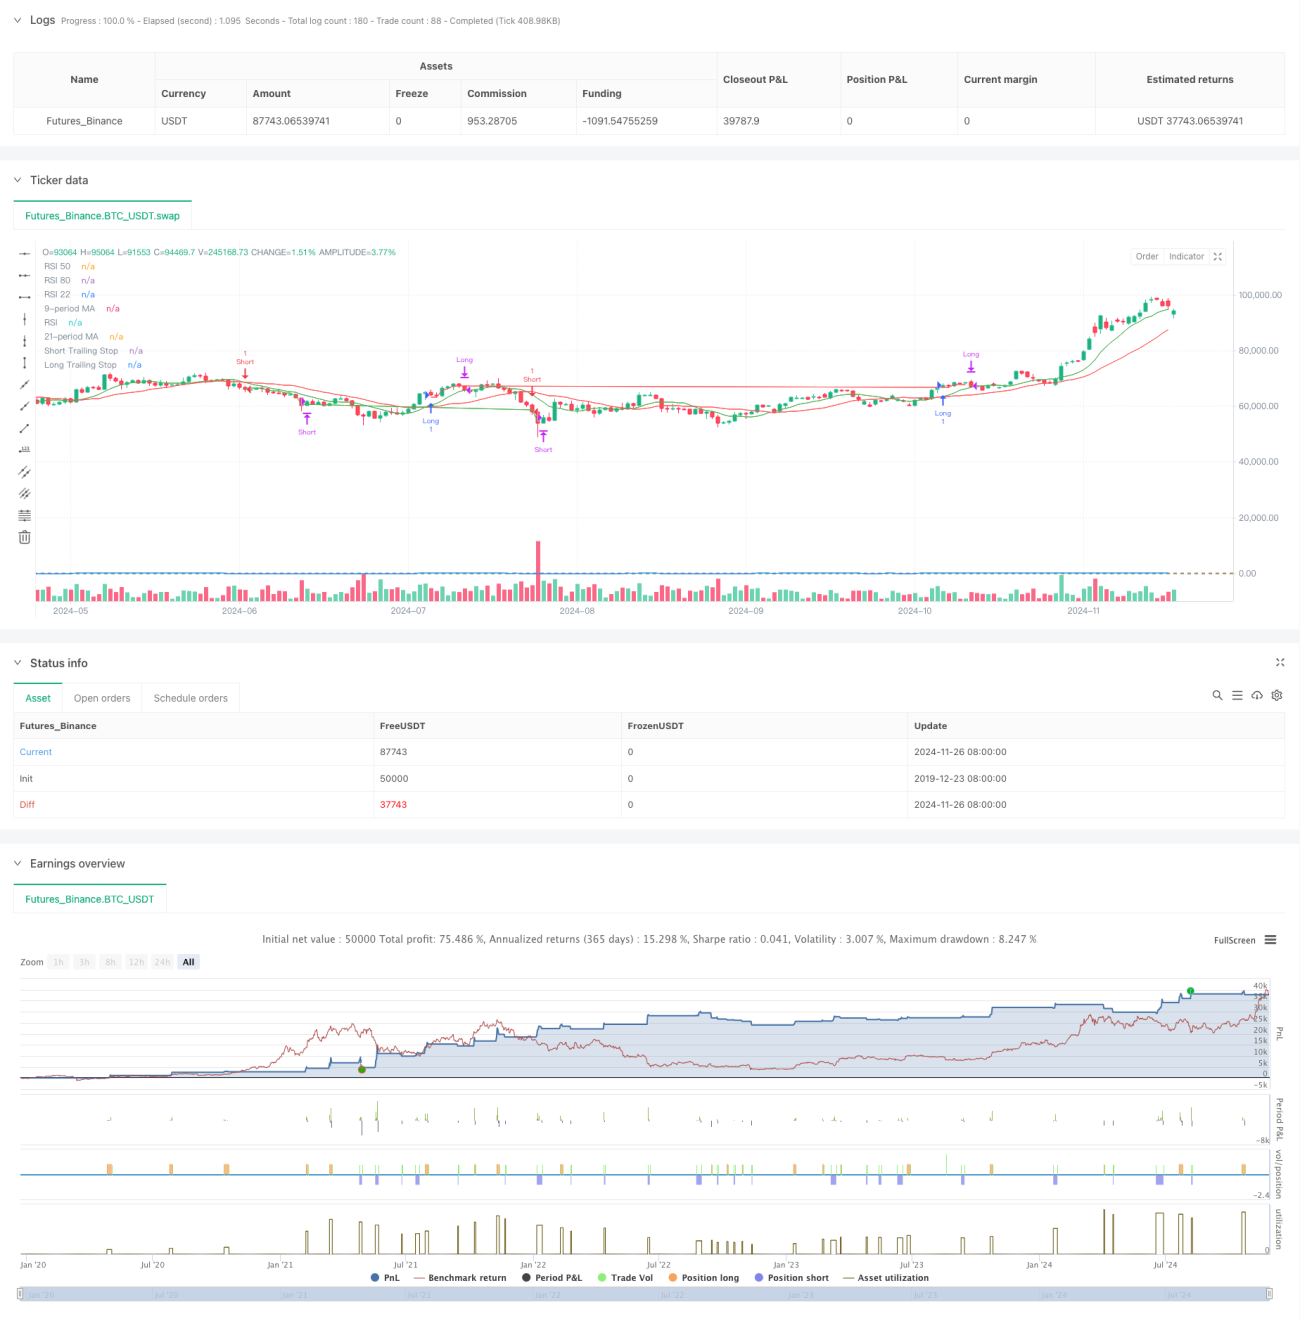
- Identification de la tendance: Identifier les changements de tendance du marché en croisant des moyennes mobiles rapides (de 9 cycles) et lentes (de 21 cycles). Un signal de pause est généré lorsque la ligne rapide traverse la ligne lente et que le RSI est supérieur à 55; un signal de pause est généré lorsque la ligne rapide traverse la ligne lente et que le RSI est inférieur à 45.
- Confirmation du signal: utilisation du RSI comme filtre de signal pour améliorer la fiabilité des signaux de négociation en définissant des seuils RSI.
- Contrôle du risque: utilisation d'un stop tracking à 1%, ajustement dynamique de la position de stop loss pour protéger les gains. En même temps, la mise en place d'une condition de clôture de prise de profit basée sur le RSI, avec des positions nettes et vides lorsque le RSI est supérieur à 80 ou inférieur à 22, respectivement.
- Mécanisme de stop loss: Combinant un stop fixe et un stop suivi, le prix est automatiquement éliminé lorsque le pourcentage prédéfini du point d'entrée est franchi ou que la ligne de stop suivi est atteinte.
Avantages stratégiques
- Vérification de signaux multidimensionnels: amélioration de l'exactitude des signaux de transaction par la double confirmation de la croix de la ligne moyenne et du RSI.
- Une bonne gestion des risques: le suivi dynamique des pertes permet de protéger les bénéfices tout en contrôlant les risques.
- Un mécanisme d'entrée flexible: une combinaison de tendances et d'indicateurs de dynamique permettant de capturer efficacement les points de basculement du marché.
- Le niveau d'automatisation est élevé: la logique de la stratégie est claire et il est facile d'automatiser les transactions.
- Adaptabilité: Adaptation aux différents environnements du marché par l'ajustement des paramètres.
Risque stratégique
- Risque de choc du marché: Faux signaux de rupture peuvent être fréquents dans les marchés à choc horizontal.
- Risque de glissement: la perte de points de glissement est possible lors de l'exécution des arrêts de suivi.
- Sensitivité des paramètres: les paramètres de la période de la moyenne et de la limite du RSI ont une influence importante sur la performance de la stratégie.
- Risque systémique: dans des cas extrêmes, le stop loss peut ne pas être exécuté à temps.
Orientation de l'optimisation de la stratégie
- Optimisation des signaux: les indicateurs de volume d'acheminement peuvent être introduits comme condition complémentaire à la confirmation des signaux.
- Optimisation des stop-loss: un mécanisme d'ajustement dynamique du stop-loss proportionnel basé sur la volatilité est envisagé.
- Gestion des positions: ajout d'un système dynamique de gestion des positions basé sur une évaluation des risques.
- Adaptabilité du marché: ajout d'un mécanisme de reconnaissance de l'environnement du marché, utilisant différents paramètres dans différents états du marché.
- Filtrage des signaux: Un filtre temporel peut être ajouté pour éviter les échanges aux heures de volatilité avant l'ouverture et la fermeture du marché.
Résumer
La stratégie, combinant les indicateurs classiques de l'analyse technique, construit un système de négociation avec des caractéristiques à la fois de suivi de tendance et de dynamique. Son avantage central réside dans un mécanisme de confirmation de signal multidimensionnel et un système de gestion du risque parfait. Grâce à une optimisation et à une amélioration continues, la stratégie devrait maintenir une performance stable dans différents environnements de marché.
- 1