Système de trading hybride à double chaîne avec moyenne mobile de suivi de la dynamique

Aperçu
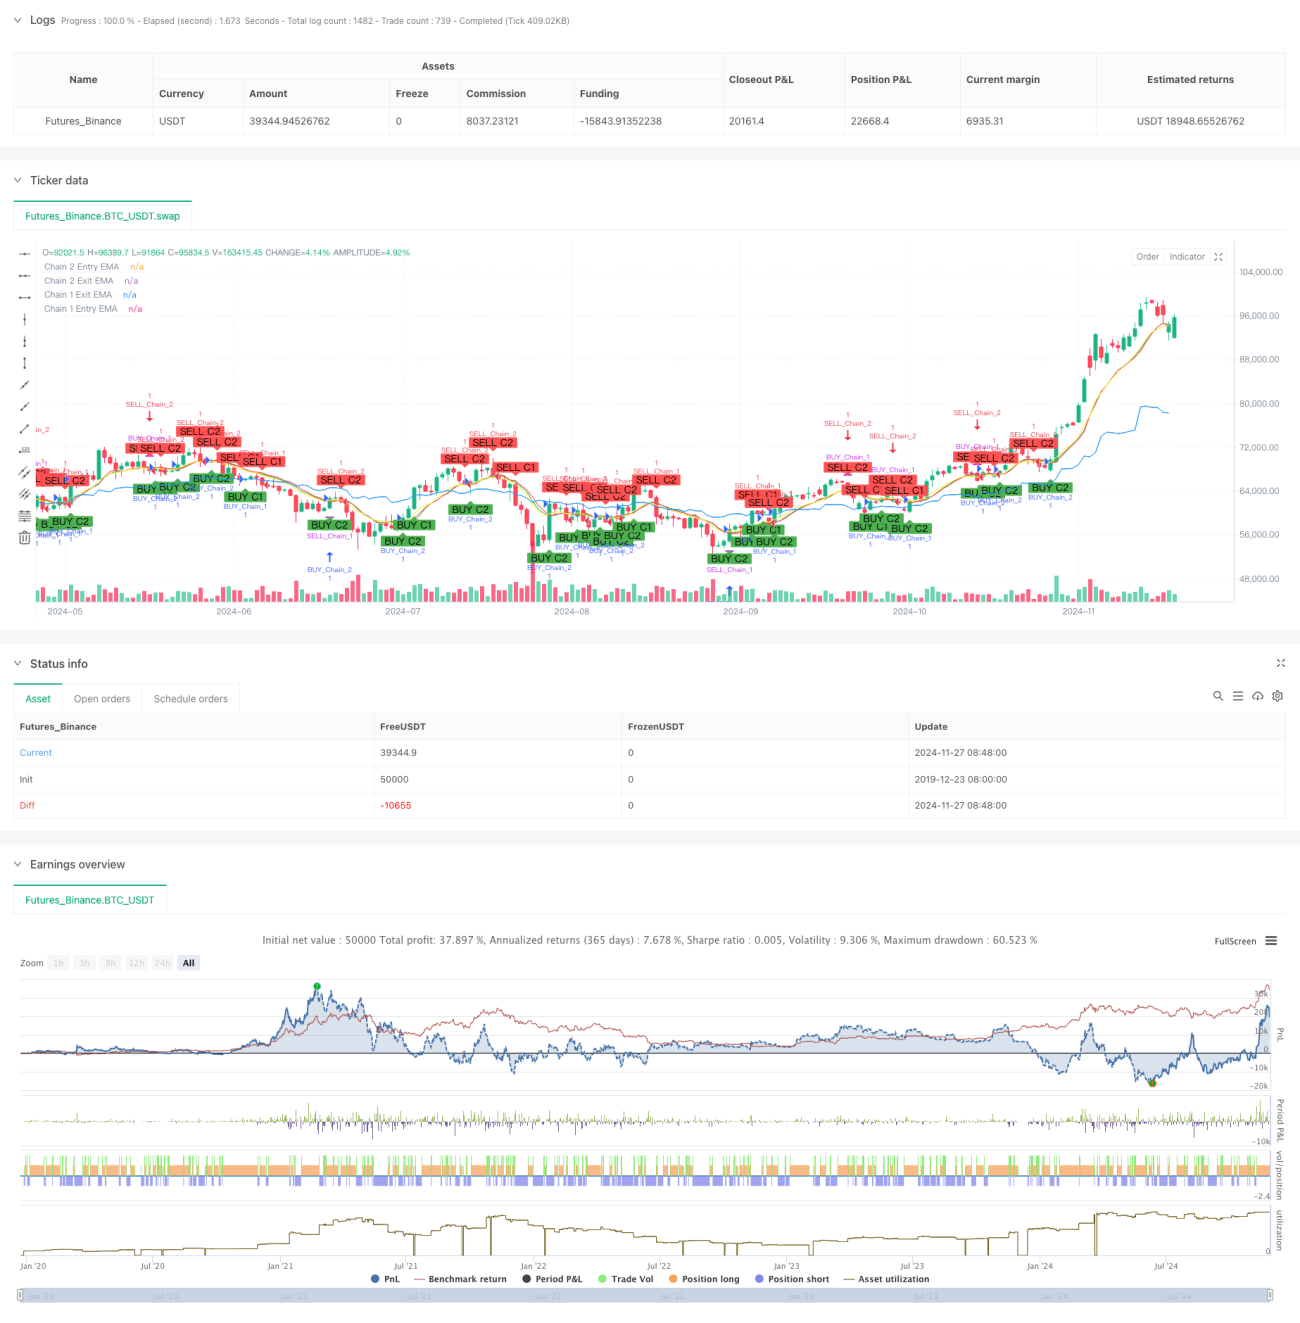
La stratégie est un système de trading innovant basé sur des moyennes mobiles indicielles (EMA) qui capture les opportunités de marché en mettant en place deux chaînes de trading indépendantes dans des périodes de temps différentes. La stratégie intègre les avantages du suivi de la tendance à long terme et de la négociation de la dynamique à court terme.
Principe de stratégie
La stratégie utilise une conception à deux chaînes, chacune avec sa propre logique d'entrée et de sortie:
La chaîne 1 ((Tendance à long terme) utilise la périodicité de la périphérie et de la ligne solaire:
- Signal d'entrée: signal de multiplication produit lorsque le prix de clôture traverse l'EMA sur le cycle de la courbe
- Signal de sortie: un signal de clôture est généré lorsque le prix de clôture traverse l'EMA sous le cycle de la ligne solaire
- Le cycle EMA par défaut est de 10 et peut être ajusté selon les besoins.
La chaîne 2 (motivation à court terme) utilise des cycles de 12 heures et 9 heures:
- Signal d'entrée: signal de multiplication produit lorsque le prix de clôture traverse l'EMA sur un cycle de 12 heures
- Signal de sortie: un signal de clôture est généré lorsque le prix de clôture traverse l'EMA sur un cycle de 9 heures
- Le cycle EMA par défaut est de 9 et peut être ajusté selon les besoins
Avantages stratégiques
- Une analyse multidimensionnelle du marché: une compréhension globale des tendances du marché en combinant différentes périodes de temps
- Flexibilité: les deux chaînes peuvent être activées ou désactivées indépendamment pour s'adapter à différents styles de négociation
- Contrôle des risques: confirmation à plusieurs cycles de temps, réduction du risque de faux signaux
- Les paramètres sont réglables: les cycles EMA et les cycles de temps peuvent être modifiés selon les besoins
- Fonctionnalité de rétroaction améliorée: réglage intégré pendant la rétroaction pour faciliter la vérification et l'optimisation de la stratégie
Risque stratégique
- Risque de renversement de la tendance: une rétrogradation possible dans un marché très volatil
- Risque de configuration de la période: différents marchés peuvent avoir besoin de différentes combinaisons de périodes
- Risque d'optimisation des paramètres: une optimisation excessive peut entraîner une suradaptation
- Risque de chevauchement des signaux: deux chaînes déclenchées simultanément peuvent augmenter le risque de détention de positions
Suggestions de contrôle des risques :
- Définissez un stop-loss raisonnable
- Paramètres ajustés en fonction des caractéristiques du marché
- Une vérification complète avant la mise en service
- Contrôler le ratio de fonds propres pour chaque transaction
Orientation de l'optimisation de la stratégie
- Optimisation du filtrage du signal :
- Ajouter un mécanisme de confirmation du volume
- Introduction de signaux de filtrage pour les indicateurs de volatilité
- Confirmation de l'augmentation de la force de la tendance
- Optimisation du contrôle des risques :
- Développement d'un mécanisme d'arrêt dynamique
- Système de gestion des positions
- Ajout de contrôle de rétractation
- Optimisation du cycle:
- Les combinaisons optimales de périodes de temps
- Développement d'un mécanisme de cycle de temps adaptatif
- Ajout de fonctionnalités de reconnaissance de l'état du marché
Résumer
Le système de trading de suivi de la moyenne de la quantité mixte à double chaîne permet une analyse et une maîtrise multidimensionnelles du marché grâce à une combinaison innovante de stratégies de courte et longue durée. La conception du système est flexible et peut être adaptée en fonction des différentes conditions du marché et du style des traders.
- 1