Aperçu
La stratégie est un système de négociation intégré qui combine un système bi-homogène, une analyse des indicateurs de force relative (RSI) et de force relative (RS). La stratégie permet la confirmation de la tendance par la confirmation croisée des moyennes mobiles (EMA) des indices des 13e et 21e jours, ainsi que la confirmation des signaux de négociation en combinaison avec le RSI et la valeur du RS par rapport à l’indice de référence.
Principe de stratégie
La stratégie utilise un mécanisme de confirmation de signaux multiples:
- Le signal d’entrée doit satisfaire aux conditions suivantes:
- EMA13 avec un EMA21 ou un prix supérieur à EMA13
- Le RSI est supérieur à 60.
- L’intensité relative (RS) est positive
- Les conditions de sortie sont les suivantes:
- Le prix a chuté à moins de 21 EMA
- RSI inférieur à 50
- RS est négatif.
- Conditions de réintégration:
- Le prix est porté sur EMA13 et EMA13 est plus grand que EMA21
- RS maintenu à zéro
- Ou le prix a dépassé le sommet de la semaine dernière
Avantages stratégiques
- Un mécanisme de confirmation de signaux multiples réduit le risque de fausse intrusion
- Une analyse de l’intensité relative pour sélectionner efficacement les variétés fortes
- Le mécanisme d’ajustement de la période d’adaptation
- Un système de contrôle des risques bien mis en place
- Un mécanisme de réintégration intelligent
- Fournir une visualisation de l’état des transactions en temps réel
Risque stratégique
- Les marchés en crise peuvent générer des transactions fréquentes
- La dépendance à plusieurs indicateurs peut entraîner un retard de signal
- Les seuils RSI fixes peuvent ne pas s’appliquer à tous les environnements de marché
- Le calcul de l’intensité relative dépend de l’exactitude des indices de référence
- Le stop loss à 52 semaines peut être trop relâché
Orientation de l’optimisation de la stratégie
- Introduction d’une barre RSI adaptée
- Logique de jugement pour optimiser les conditions de réadmission
- Augmentation de la dimension de l’analyse du volume des transactions
- Améliorer le mécanisme de stop-profit et de stop-loss
- Ajout d’un filtre de fréquence
- Optimiser le cycle de calcul de l’intensité relative
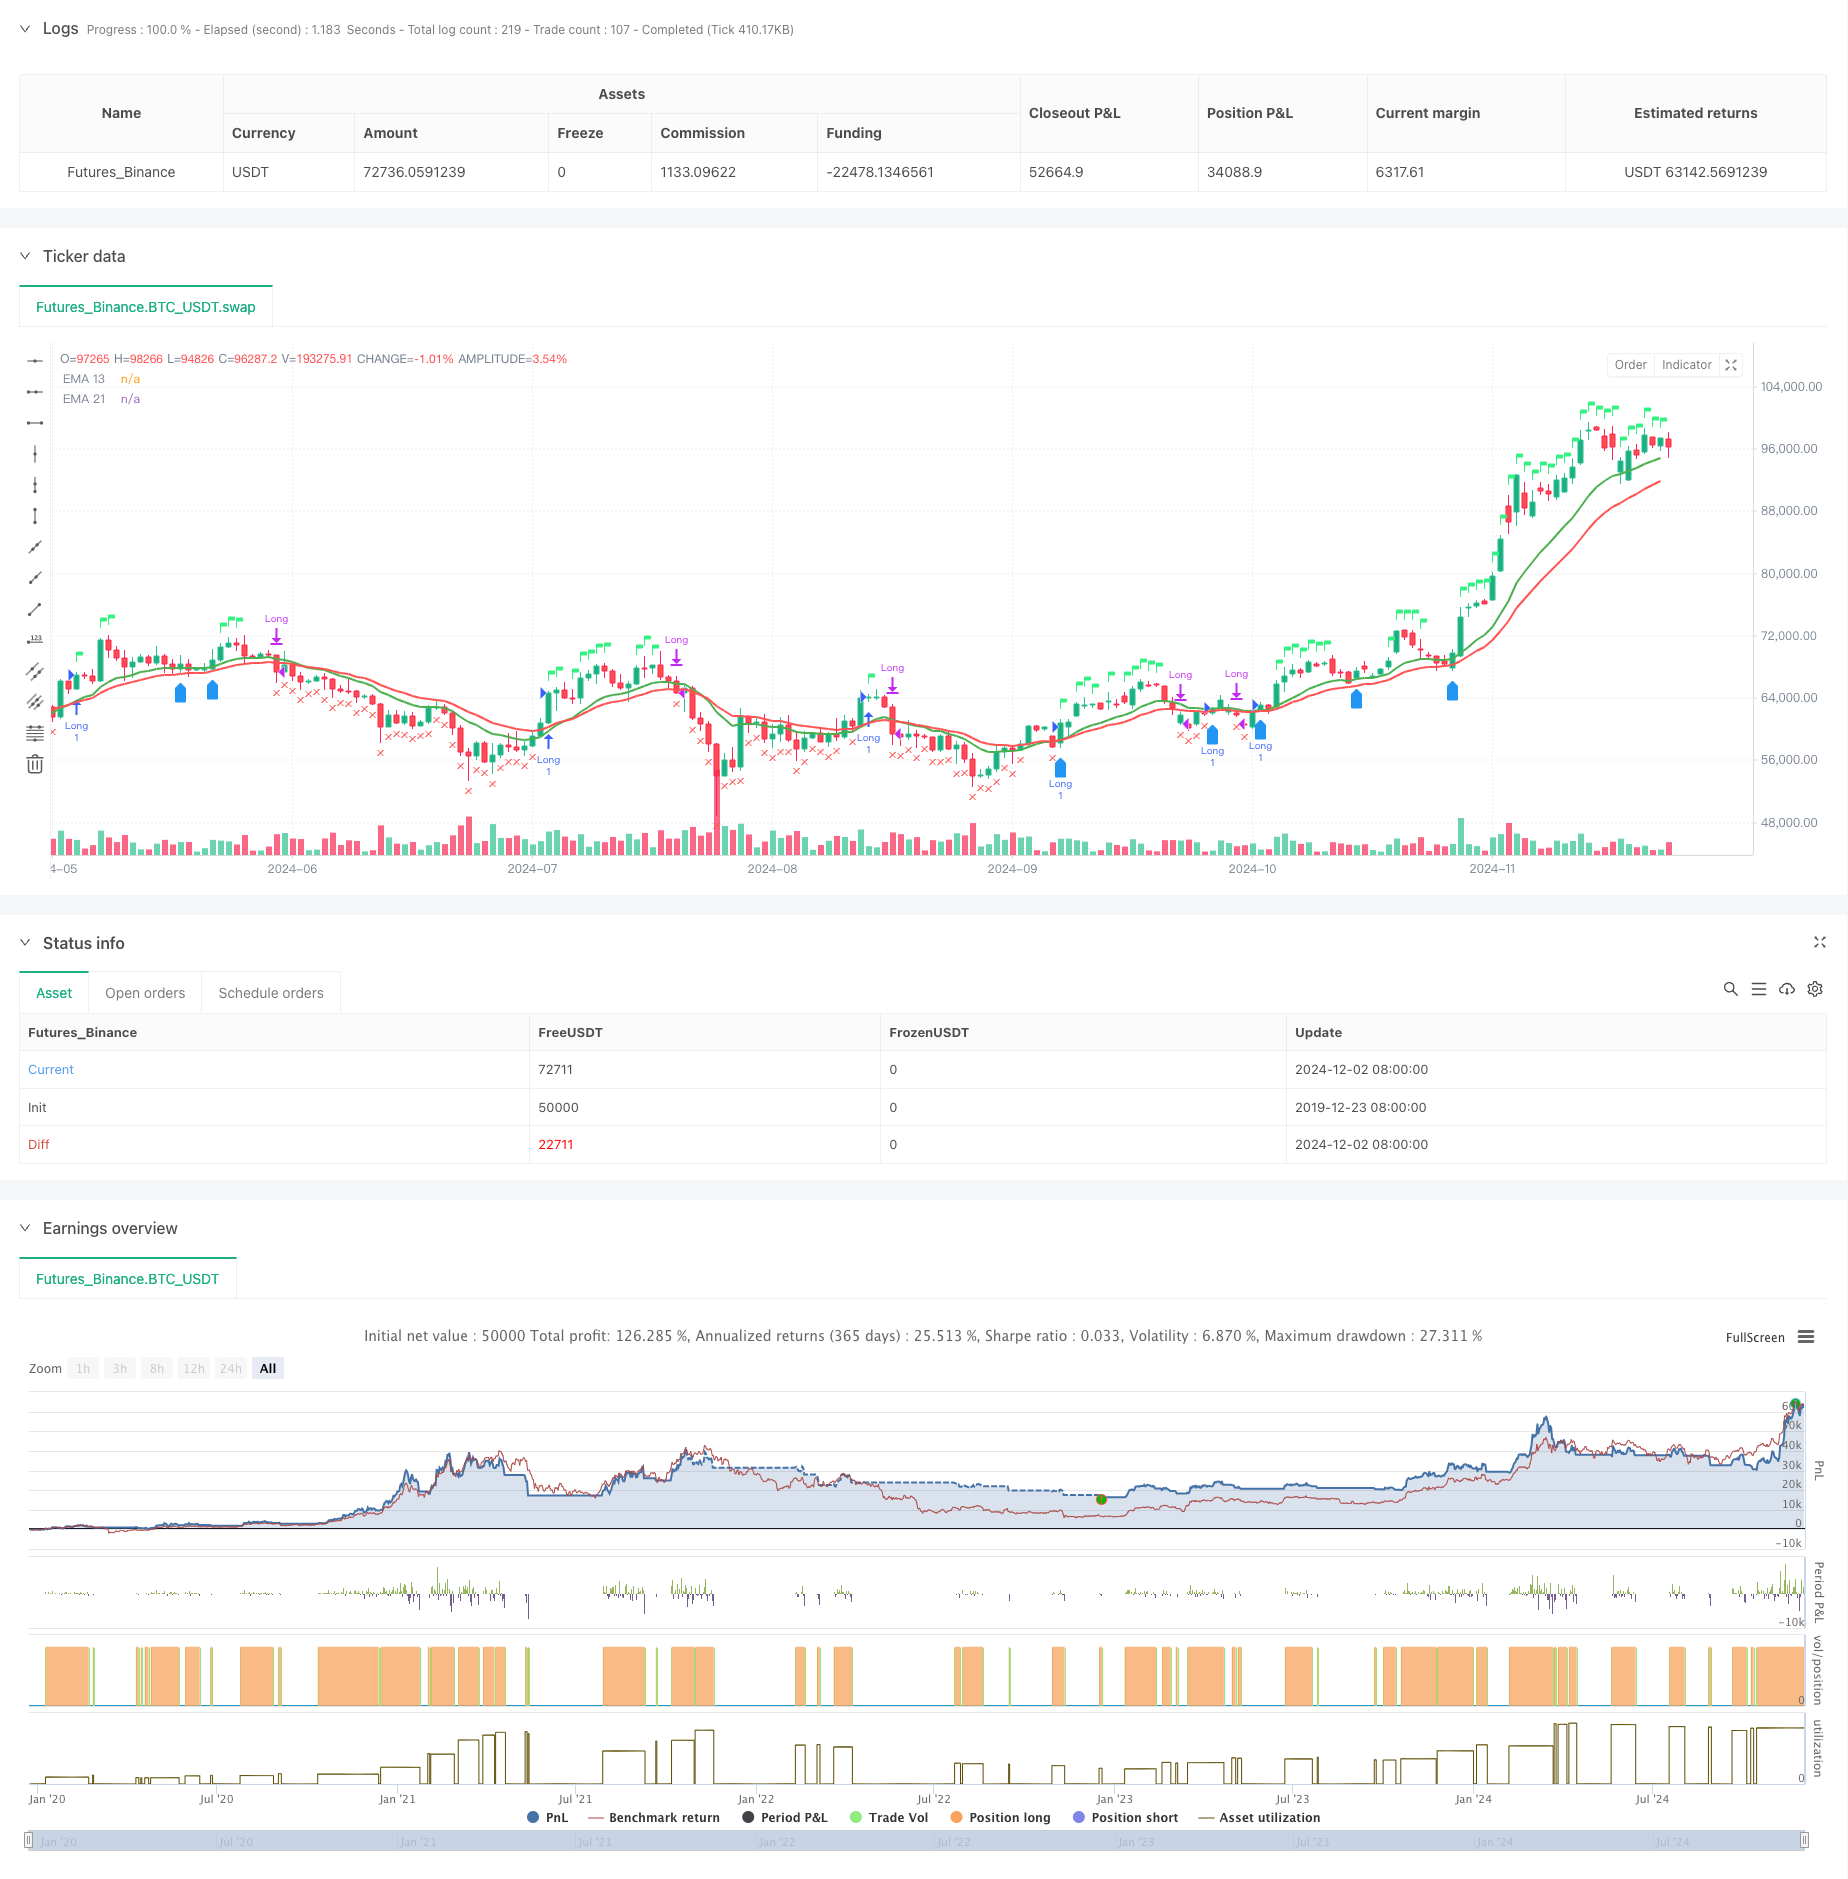
Résumer
La stratégie est construite sur un système de négociation complet par la combinaison de l’analyse technique et de l’analyse de la force relative. Ses mécanismes de confirmation de signaux multiples et son système de contrôle des risques lui confèrent une grande utilité. La stratégie a encore de la place pour être améliorée par les orientations d’optimisation suggérées. La mise en œuvre réussie de la stratégie nécessite une compréhension approfondie du marché par le trader et un ajustement approprié des paramètres en fonction des caractéristiques de la variété de négociation.
/*backtest
start: 2019-12-23 08:00:00
end: 2024-12-03 00:00:00
period: 1d
basePeriod: 1d
exchanges: [{"eid":"Futures_Binance","currency":"BTC_USDT"}]
*/

//@version=5
strategy("EMA 13 & 21 Entry Exit", overlay=true)

// Define the EMAs
ema13 = ta.ema(close, 13)
ema21 = ta.ema(close, 21)

// Define the RSI
rsi = ta.rsi(close, 14)

// Calculate the closing price relative to Nifty 50
//nifty50 = request.security("NSE:NIFTY", timeframe.period, close)
//closeRelative = close / nifty50

// Define a base period (e.g., 123) and adjust it based on the timeframe
//basePeriod = 123

// Calculate the effective period based on the timeframe
//effectivePeriod = basePeriod * (timeframe.isintraday ? (60 / timeframe.multiplier) : 1)

// Calculate the EMA
//rs = ta.ema(closeRelative, effectivePeriod)

// Define the Relative Strength with respect to NIFTY 50
nifty50 = request.security("swap", "D", close)
rs = ta.ema(close / nifty50, 55 )

// Define the previous 2-week low and last week's high
twoWeekLow = ta.lowest(low, 10)  // 10 trading days roughly equal to 2 weeks
lastWeekHigh = ta.highest(high, 5)  // 5 trading days roughly equal to 1 week
fiftytwoWeekhigh = ta.highest(high, 52*5) // 252 tradingdays roughly equal to 52 week.

// Long condition: EMA 21 crossing above EMA 55, price above EMA 21, RSI > 50, and RS > 0
longCondition = ta.crossover(ema13, ema21) or close > ema13 and rsi > 60 and rs > 0

// Exit condition: Price closing below EMA 55 or below the previous 2-week low
exitCondition = close < ema21 or rsi < 50 or rs < 0 //or close < fiftytwoWeekhigh*0.80

// Re-entry condition: Price crossing above EMA 21 after an exit, EMA 21 > EMA 55, and RS > 1
reEntryCondition = ta.crossover(close, ema13) and ema13 > ema21 and rs > 0

// Re-entry condition if trailing stop loss is hit: Price crossing above last week's high
reEntryAfterSL = ta.crossover(close, lastWeekHigh)

// Plot the EMAs
plot(ema13 ,color=color.green, title="EMA 13",linewidth = 2)
plot(ema21, color=color.red, title="EMA 21",linewidth = 2)


// Plot buy and sell signals
plotshape(series=longCondition, location=location.abovebar, color=color.rgb(50, 243, 130), style=shape.flag, title="Buy Signal")
plotshape(series=exitCondition, location=location.belowbar, color=color.red, style=shape.xcross, title="Sell Signal")
plotshape(series=reEntryCondition or reEntryAfterSL, location=location.belowbar, color=color.blue, style=shape.labelup, title="Re-entry Signal")
//plotshape(series = fiftytwoWeekhigh,location=location.abovebar, color=color.blue,style=shape.flag, title="52WH")

// Plot background color for RS > 0
//bgcolor(rs > 0 ? color.new(color.green, 90) : na, title="RS Positive Background")
// Plot the previous 2-week low and last week's high
// plot(twoWeekLow, color=color.orange, title="2-Week Low")
// plot(lastWeekHigh, color=color.purple, title="Last Week High")

// Strategy logic
if (longCondition or reEntryCondition or reEntryAfterSL)
    strategy.entry("Long", strategy.long)

if (exitCondition)
    strategy.close("Long")

 // Calculate Stop Loss (SL) and Profit
var float entryPrice = na
var float stopLoss = na
var float profit = na

if (strategy.opentrades > 0)
    entryPrice := strategy.opentrades.entry_price(strategy.opentrades - 1)
    stopLoss := fiftytwoWeekhigh * 0.80
    profit := (close - entryPrice) / entryPrice * 100

// Display the strategy table
var table strategyTable = table.new(position.top_right, 4, 2, border_width = 1)

// Make the table movable
tableX = input.int(0, title="Table X Position")
tableY = input.int(0, title="Table Y Position")

// Add size options for the table
tableSize = input.string("small", title="Table Size", options=["tiny", "small", "large"])

// Adjust table size based on user input
tableWidth = tableSize == "tiny" ? 2 : tableSize == "small" ? 4 : 6
tableHeight = tableSize == "tiny" ? 1 : tableSize == "small" ? 2 : 3

// Create the table with the specified size
//table = table.new(position.top_right, tableWidth, tableHeight, border_width = 1)

// Position the table based on user input
// table.cell(strategyTable, tableX, tableY, "Entry Price",  bgcolor=#18eef9)
// table.cell(strategyTable, tableX, tableY + 1, str.tostring(entryPrice, format.mintick), bgcolor=#18eef9)
// table.cell(strategyTable, tableX + 1, tableY, "Stop Loss (20%)", bgcolor=color.red)
// table.cell(strategyTable, tableX + 1, tableY + 1, str.tostring(stopLoss, format.mintick), bgcolor=color.red)
// table.cell(strategyTable, tableX + 2, tableY, "Profit (%)", bgcolor=color.green)
// table.cell(strategyTable, tableX + 2, tableY + 1, str.tostring(profit, format.percent), bgcolor=color.green)