Stratégie de trading dynamique basée sur les bandes de Bollinger et les indicateurs RSI

Aperçu
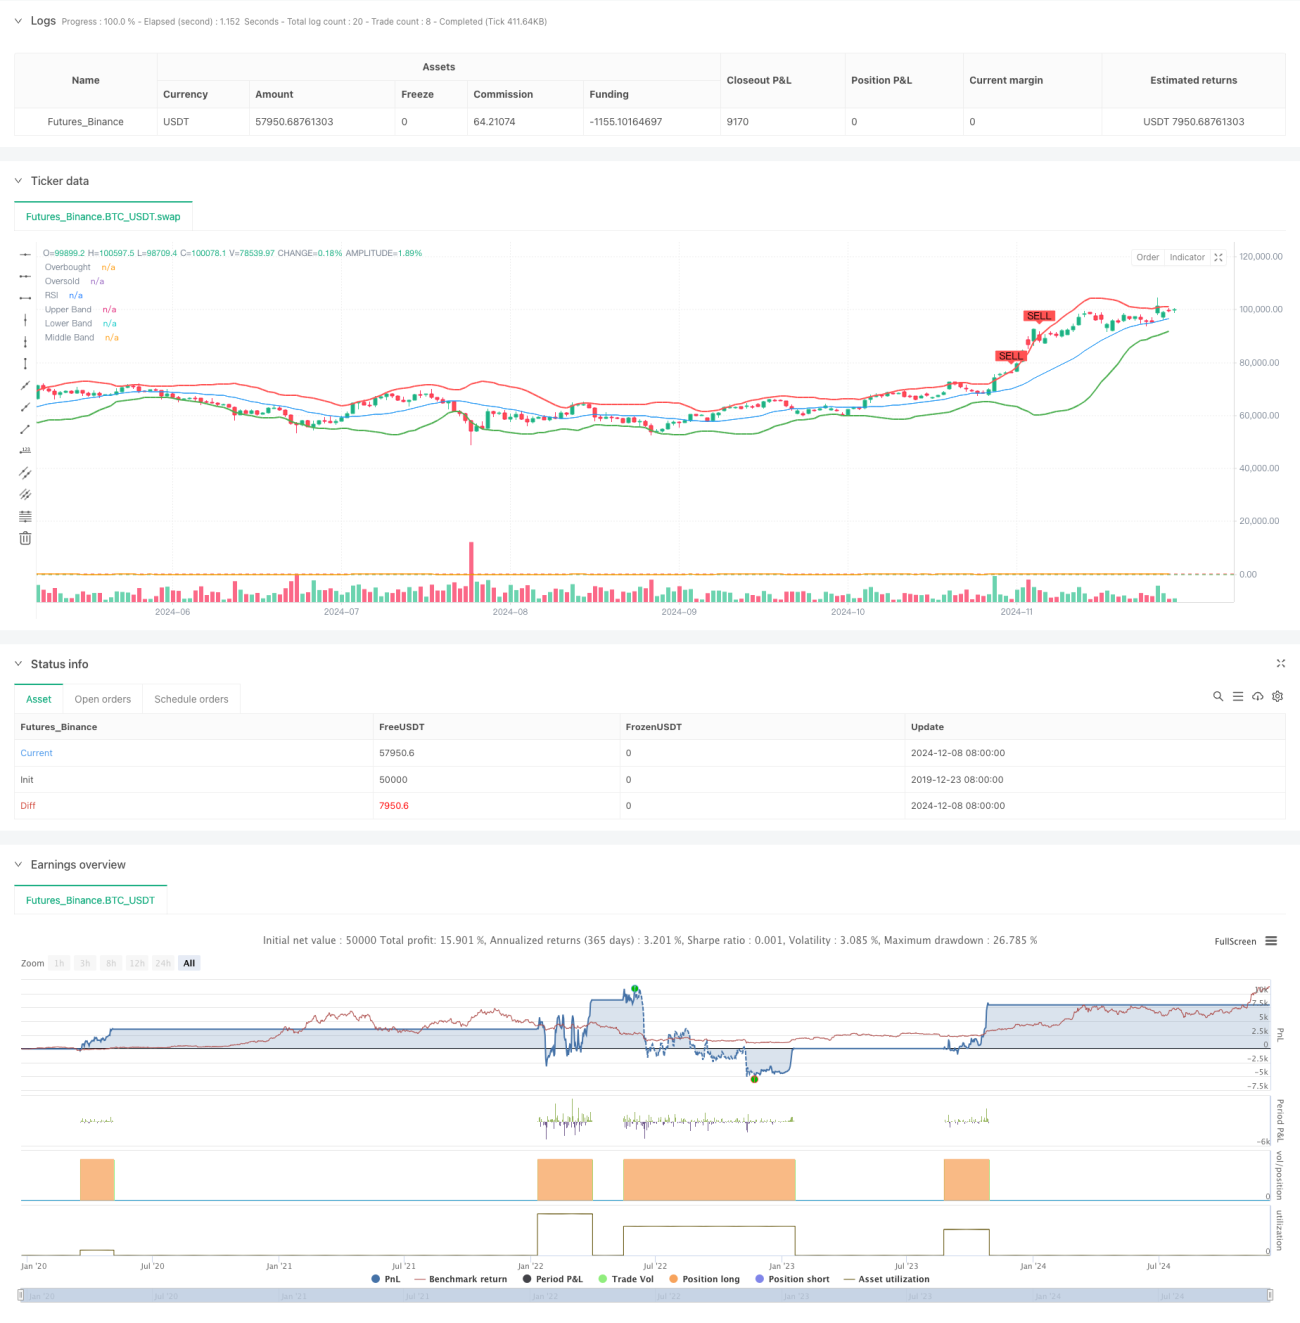
Cette stratégie est un système de trading auto-adaptatif combinant les bandes de Bollinger et l'indice relativement faible RSI. La stratégie identifie les opportunités de trading potentielles en utilisant les canaux de prix des bandes de Bollinger et les signaux de survente et de survente du RSI pour capturer les tendances et les fluctuations du marché.
Principe de stratégie
Le cœur de la stratégie est de capturer les opportunités de fluctuation du marché en combinant les indicateurs RSI de la bande de Brin vers le haut, le milieu et le bas. La bande de Brin est basée sur une moyenne mobile de 20 cycles et est calculée en utilisant 2 fois le décalage standard. Le RSI utilise un calcul de 14 cycles et définit 70 comme niveau de survente et 30 comme niveau de survente.
Avantages stratégiques
- Adaptabilité: Blink peut ajuster automatiquement les zones de négociation en fonction des fluctuations du marché et s'adapter à différentes conditions de marché.
- Signal fiable: réduction significative des faux signaux grâce au mécanisme de double confirmation de la bande de Bryn et du RSI.
- Contrôle des risques: Le calcul de l'écart-type de la ceinture de Brindille fournit un mécanisme de contrôle des risques dynamique.
- L'effet visuel: la stratégie fournit un signal visuel clair pour faciliter la compréhension et l'exécution par les traders.
- Flexibilité des paramètres: les principaux paramètres peuvent être ajustés en fonction des caractéristiques du marché.
Risque stratégique
- Risque de choc du marché: Des signaux de fausse rupture fréquents peuvent être générés par des chocs horizontaux.
- Le risque de retard: les moyennes mobiles et le RSI ont un certain retard.
- Sensitivité des paramètres: différents paramètres peuvent entraîner des différences importantes dans les performances de la stratégie.
- La dépendance aux conditions du marché: la performance est meilleure dans les marchés où la tendance est évidente et peut être moins efficace dans les marchés de choc.
Orientation de l'optimisation de la stratégie
- Introduction de filtres de tendance: ajouter des moyennes mobiles à long terme ou des indicateurs de tendance pour filtrer la direction des transactions.
- Ajustement des paramètres dynamiques: ajuste automatiquement les paramètres des bandes de Brin et du RSI en fonction des fluctuations du marché.
- Augmentation de la confirmation du trafic: ajout d'une analyse du trafic au système de signaux.
- Optimiser les paramètres de stop loss: introduire des mécanismes de stop loss dynamiques, tels que le stop loss ATR ou le stop loss mobile en pourcentage.
- Filtre d'ajout: tenir compte des caractéristiques horaires du marché et éviter de négocier à des heures inappropriées.
Résumer
La stratégie a pour avantage de pouvoir s'adapter aux fluctuations du marché et de fournir des signaux de trading fiables, mais il faut toujours tenir compte de l'impact de l'environnement du marché sur la performance de la stratégie. La stabilité et la fiabilité de la stratégie sont susceptibles d'être encore améliorées grâce à l'orientation optimisée de la stratégie.
- 1