Stratégie de trading de suivi de tendance à moyennes mobiles multiples

Aperçu
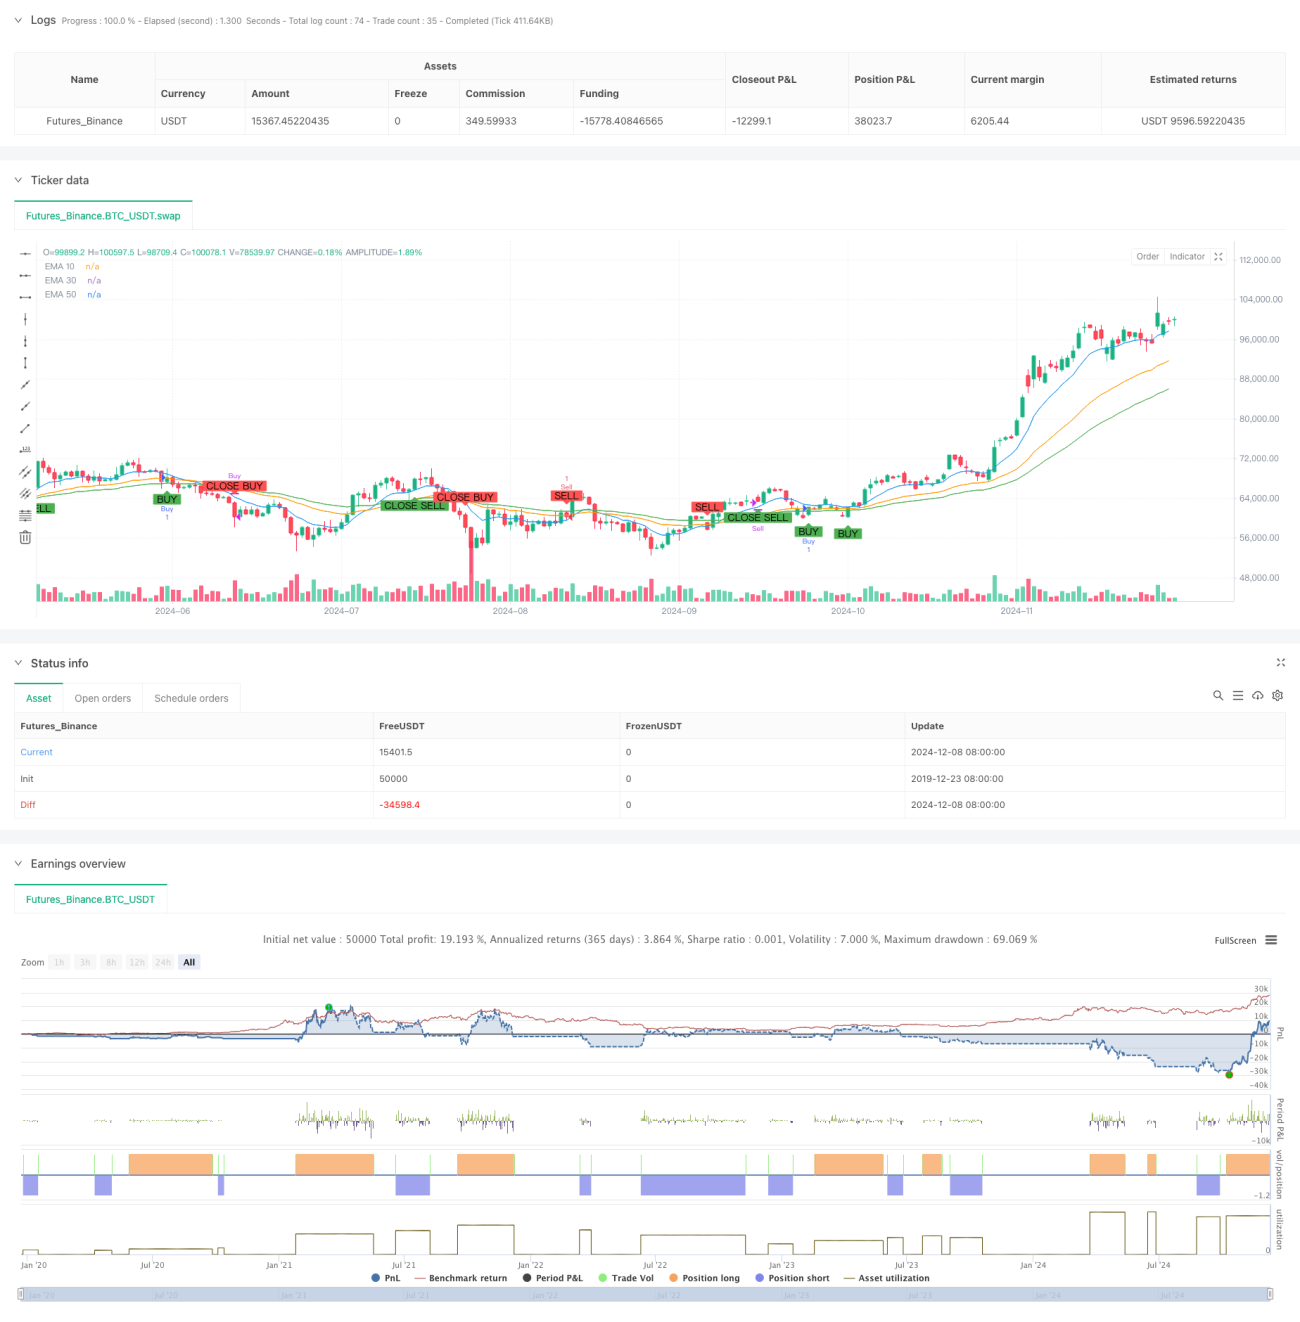
La stratégie est un système de suivi des tendances basé sur des moyennes mobiles à indices multiples (EMA). En utilisant trois lignes EMA de différentes périodes (EMA 10, 30, 50), combinées à la traversée des prix et à la direction de la tendance, elle construit un système complet de signaux d'achat et de vente. La stratégie est conçue en tenant compte de la formation, de la confirmation et de l'inversion des tendances, afin de capturer efficacement les principales opportunités de tendance sur le marché.
Principe de stratégie
La stratégie utilise un mécanisme de jugement hiérarchique pour identifier les signaux de trading:
- La couche de jugement de la tendance: utilise la relation de position des trois EMA ((10/30/50) pour juger de la direction de la tendance. Elle est jugée comme une tendance à la hausse lorsque l'EMA10 > EMA30 > EMA50; jugée comme une tendance à la baisse lorsque l'EMA50 > EMA30 > EMA10.
- La couche de déclenchement du signal: sur la base de l'établissement de la tendance, un signal de transaction spécifique est déclenché par la croisée du prix avec l'EMA30. La traversée vers le haut de l'EMA30 déclenche l'achat et la traversée vers le bas déclenche la vente.
- Gestion de la position équilibrée: lorsque l'EMA30 et l'EMA50 se croisent à l'envers, un signal d'équilibre est déclenché dans la direction correspondante. Cela fournit un mécanisme d'exit systématique.
Avantages stratégiques
- Mécanisme de confirmation multiple: fournit une confirmation multiple par l'arrangement et la croisée de plusieurs lignes uniformes, réduisant les fausses interférences.
- Il est capable de mieux saisir les principales tendances et de filtrer les fluctuations à court terme.
- Une forte systématisation: les conditions d'entrée et de sortie sont claires et ne sont pas influencées par des jugements subjectifs.
- Adaptabilité: les paramètres de l'EMA peuvent être adaptés à différents environnements de marché.
- Le contrôle des risques est raisonnable: les pertes sont maîtrisées en temps opportun grâce à des signaux de renversement de tendance.
Risque stratégique
- Risque de décalage: il peut y avoir de fréquents faux signaux lors des fluctuations du marché, entraînant des pertes continues.
- Risque de retard: le système de ligne moyenne présente un certain retard et risque de manquer des opportunités de prix importantes au début de la tendance.
- Risque de sursaut: risque de sursaut majeur en cas de forte volatilité, affectant la performance de la stratégie.
- Sensibilité des paramètres : différentes combinaisons de paramètres peuvent entraîner de grandes différences dans les performances de la stratégie.
Orientation de l'optimisation de la stratégie
- Introduction d'indicateurs de volatilité: il est recommandé d'ajouter des indicateurs de volatilité tels que l'ATR pour ajuster dynamiquement la taille des positions et améliorer l'efficacité de l'utilisation des fonds.
- Optimisation du filtrage: augmentation des indicateurs auxiliaires tels que le trafic et la puissance pour filtrer les faux signaux.
- Amélioration des mécanismes d'arrêt des pertes: il est recommandé d'ajouter la fonction de suivi des pertes pour mieux protéger les bénéfices déjà réalisés.
- Filtrage du temps: vous pouvez ajouter des limites de périodes de transaction pour éviter les périodes de plus grande volatilité.
- Adaptation des paramètres: envisager l'introduction d'un mécanisme d'adaptation pour ajuster les paramètres de l'EMA en fonction de la dynamique du marché.
Résumer
Il s'agit d'une stratégie de suivi de tendance conçue de manière rationnelle et logiquement claire. L'utilisation combinée de plusieurs lignes de moyenne assure la stabilité de la stratégie et fournit un signal de négociation clair. Bien qu'il existe un certain risque de retard, l'ensemble de la stratégie présente une meilleure valeur pratique grâce à des mesures d'optimisation et de contrôle des risques raisonnables.
- 1