
Aperçu
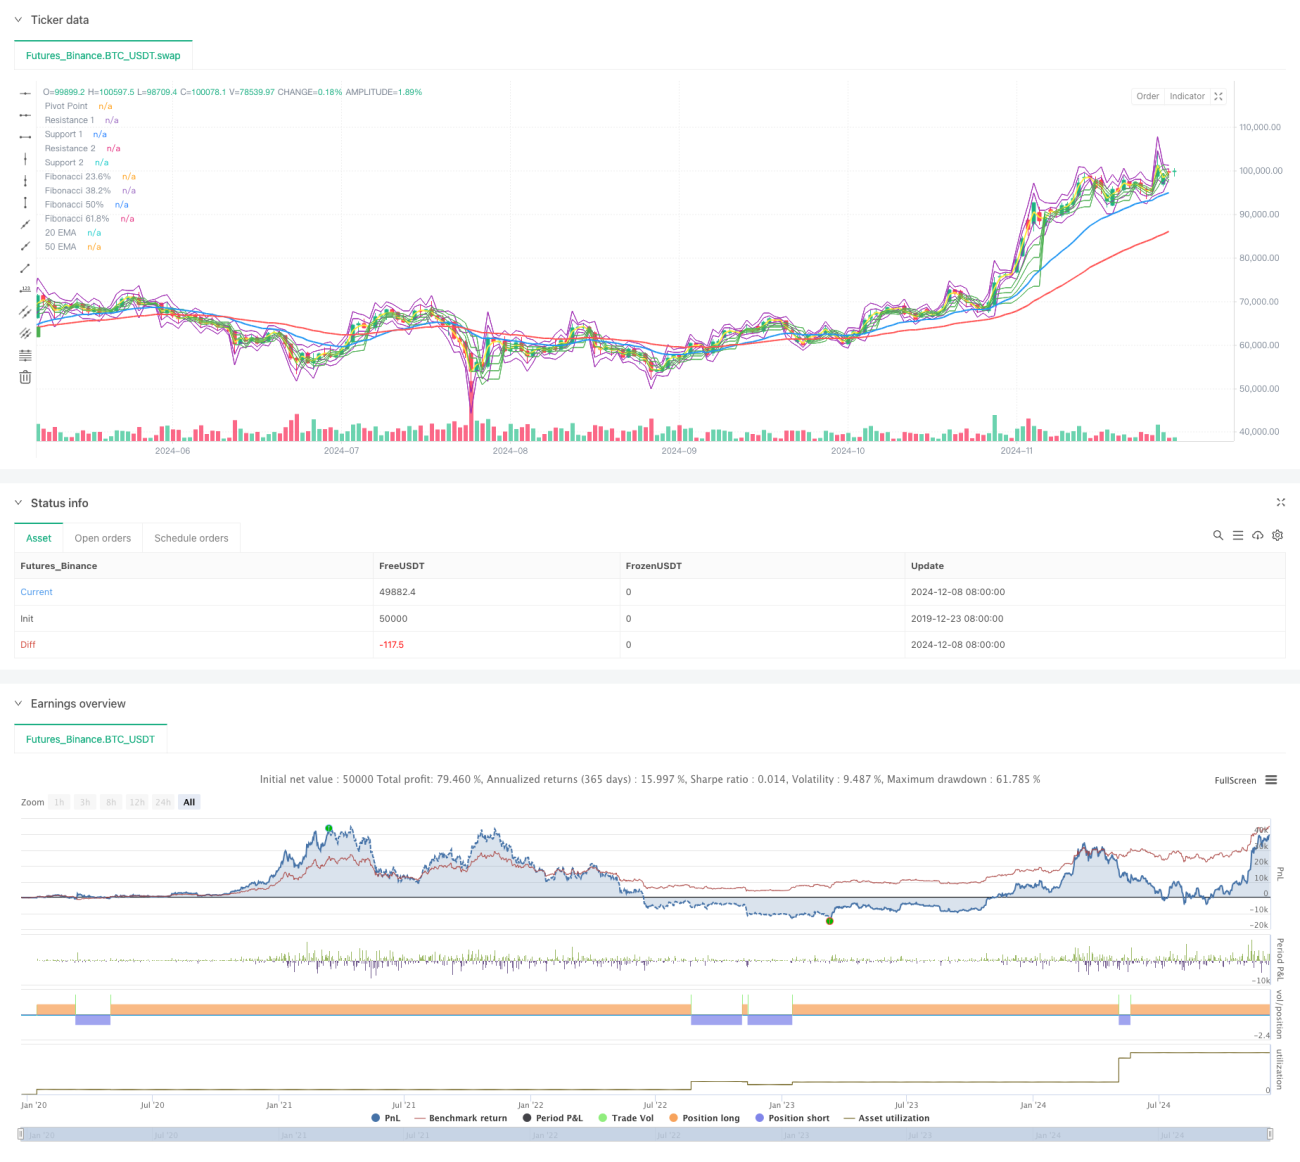
La stratégie est un système de trading intégré combinant plusieurs outils d'analyse technique, qui utilise principalement la ligne de bi-parité (EMA cyclique 20/50), les niveaux de rétroaction de Fibonacci et les niveaux de résistance de soutien des axes pour déterminer les signaux de négociation. La stratégie utilise une méthode de suivi de la tendance combinée à la rétroaction des prix pour améliorer la précision des transactions grâce à la confirmation multiple.
Principe de stratégie
La logique fondamentale de la stratégie repose sur les éléments clés suivants :
- Utilisez un croisement des EMA de 20 et 50 cycles pour déterminer la direction de la tendance générale
- Utilisez les niveaux de réajustement de Fibonacci ((23,6%, 38,2%, 50%, 61,8%) pour identifier les niveaux de résistance potentiels au support
- Le point pivot ((PP) et les points de résistance de soutien ((S1/S2, R1/R2) sont combinés pour confirmer le niveau critique de prix
- Les conditions d'entrée doivent être remplies en même temps :
- La moyenne à court terme traverse la moyenne à long terme vers le haut (en faisant plus) ou vers le bas (en faisant moins)
- Le prix est au-dessus/sous le niveau de Fibonacci approprié
- Confirmation que le prix répond à la résistance au support du pivot
- Gérer le risque en utilisant un stop-loss fixe (de 30 points) et un objectif de profit (de 60 points)
Avantages stratégiques
- Vérification croisée de multiples indicateurs techniques pour améliorer la fiabilité du signal
- La tendance et la résistance de soutien sont combinées pour équilibrer le moment d'entrée.
- Paramètres de gestion des risques fixes pour une mise en œuvre stratégique et quantifiée
- Des signaux de trading visualisés pour une surveillance en temps réel
- Convient pour le trading de tendances à moyen et long terme et réduit les effets de la volatilité à court terme
Risque stratégique
- Les multiples indicateurs peuvent entraîner des retards de signal et affecter le temps d'entrée.
- Le niveau de stop loss/gain fixe peut ne pas être adapté à tous les environnements de marché.
- Il est possible qu'il y ait trop de faux signaux dans les marchés de stockage horizontal.
- Il faut une plus grande volatilité des prix pour obtenir des rendements idéaux.
- Les stop-loss peuvent être inefficaces en cas de fortes fluctuations du marché
Orientation de l'optimisation de la stratégie
- Introduction d'un système de freinage qui s'adapte à la volatilité
- Ajouter un indicateur de volume comme confirmation auxiliaire
- Paramètres de la ligne moyenne ajustés dynamiquement en fonction des différentes conditions du marché
- Ajoutez un filtre de force de tendance pour réduire les faux signaux
- Développement de mécanismes de gestion de positions partielles plus intelligents
Résumer
La stratégie a construit un système de négociation relativement complet en intégrant plusieurs outils d'analyse technique classiques. Bien qu'il y ait un certain retard, la fiabilité des transactions a été améliorée grâce à un mécanisme de confirmation multiple. Grâce à la mise en œuvre des recommandations d'optimisation, la stratégie devrait obtenir de meilleures performances dans les transactions sur le marché réel.
- 1