
Aperçu
La stratégie est un système de trading de suivi de tendance combinant plusieurs indicateurs techniques. Elle utilise principalement les indicateurs de dérivation parallèles (SAR), les moyennes mobiles (SMA) et les indicateurs de dynamique directionnelle (DMI) pour déterminer la tendance du marché et le moment d'entrée, et pour optimiser l'exit par des arrêts de pourcentage et des dérives MACD. L'idée centrale de la conception de la stratégie est de confirmer l'entrée après une tendance forte et de sortir à temps lorsque l'objectif de profit prévu est atteint ou que des signaux de revers de tendance apparaissent.
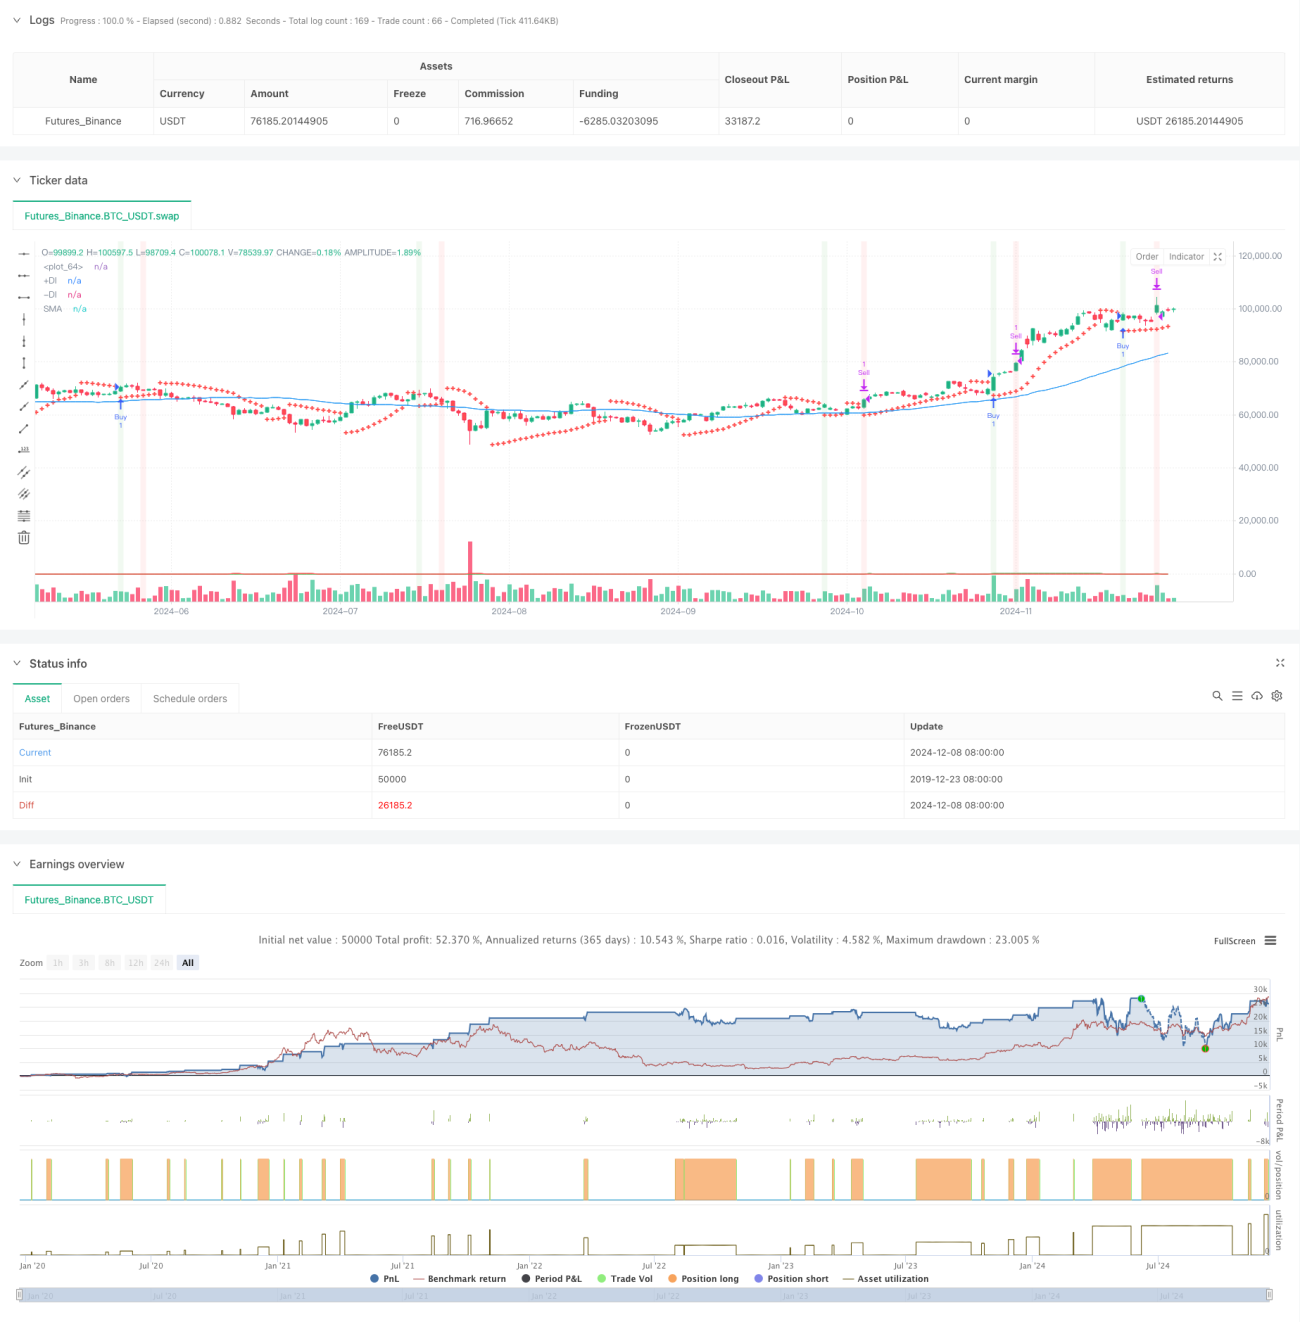
Principe de stratégie
La stratégie utilise un mécanisme de filtrage à plusieurs niveaux pour confirmer les signaux de transaction:
- Capture des signaux de trading initiaux par croisement des indicateurs SAR
- Utilisez les SMA à 50 cycles pour déterminer la direction de la tendance globale
- Utilisation de l'indicateur DMI pour confirmer la force et la direction de la tendance
- Les conditions d'entrée doivent être remplies en même temps: le prix est placé au-dessus du SAR, le prix est au-dessus du SMA et le DMI montre une tendance à plusieurs niveaux
- Mise en place d'un double mécanisme: réalisation d'un bénéfice objectif de 3% ou apparition d'un signal de dérivation MACD
- L'indicateur ATR est utilisé comme référence pour la volatilité du marché.
Avantages stratégiques
- La vérification croisée de multiples indicateurs techniques peut réduire efficacement les faux signaux
- Une combinaison de suivi des tendances et d'indicateurs dynamiques pour améliorer le taux de réussite des transactions
- Une stratégie de stop-loss à pourcentage fixe pour assurer la stabilité des profits
- Le MACD s'est éloigné du mécanisme de sortie pour éviter le retrait d'un renversement de tendance
- Les paramètres de la stratégie peuvent être ajustés de manière flexible en fonction des caractéristiques du marché
- Utilisation de l'ATR pour la surveillance de la volatilité et la fourniture d'informations sur l'état du marché
Risque stratégique
- Plusieurs indicateurs peuvent entraîner un décalage du signal
- Le taux fixe peut être retiré plus tôt dans une tendance forte.
- L'absence de mécanisme de coupe des pertes augmente l'ouverture de risque
- Le marché horizontal pourrait générer de faux signaux
- L'indicateur DMI pourrait générer des signaux trompeurs dans un marché en crise
Orientation de l'optimisation de la stratégie
- Introduction de mécanismes d'arrêt adaptatifs, tels que l'arrêt dynamique basé sur l'ATR
- Développer des filtres de volatilité pour ajuster la taille des positions pendant les périodes de forte volatilité
- Optimiser les paramètres MACD pour améliorer l'exactitude des jugements de retournement de tendance
- Ajoutez un mécanisme de confirmation du volume pour améliorer la fiabilité du signal
- Développer des mécanismes d'arrêt dynamique pour ajuster les bénéfices cibles en fonction des fluctuations du marché
Résumer
La stratégie, grâce à la collaboration synchrone de multiples indicateurs techniques, a construit un système de trading de suivi de tendance relativement complet. Son avantage réside dans la fiabilité de la reconnaissance des signaux et la flexibilité du contrôle des risques. Bien qu'il existe un certain risque de retard, la performance globale de la stratégie a une meilleure valeur d'application grâce à l'optimisation des paramètres et à l'adhésion à un mécanisme de gestion dynamique.
- 1