
Aperçu
Cette stratégie est un système de trading intelligent basé sur l'indice de force relative (RSI), combinant plusieurs moyennes mobiles et des bandes de Bollinger pour identifier les zones de surachat et de survente du marché et effectuer des transactions opportunistes. Le cœur de la stratégie repose sur les signaux de cassure et de repli du RSI, associés à différents types de moyennes mobiles pour confirmer la tendance, réalisant ainsi un trading de swing efficace. Cette stratégie présente une forte adaptabilité et peut être ajustée en fonction des différentes conditions de marché.
Principe de la stratégie
La stratégie utilise un RSI sur 14 périodes comme indicateur principal. Les signaux de trading sont générés en surveillant le croisement du RSI avec les niveaux clés de 30 et 70. Lorsque le RSI dépasse la barre des 30 à la hausse, le système considère que le marché passe d'une survente à une tendance haussière, déclenchant un signal d'achat. Lorsque le RSI passe en dessous de la barre des 70 à la baisse, le système juge que le marché passe d'un surachat à une tendance baissière, déclenchant un signal de clôture de position. Parallèlement, la stratégie intègre plusieurs types de moyennes mobiles (SMA, EMA, SMMA, WMA, VWMA) et des bandes de Bollinger comme indicateurs auxiliaires pour confirmer la direction de la tendance et la volatilité du marché.
Avantages de la stratégie
- Signaux clairs : les signaux de surachat et de survente du RSI sont évidents, faciles à comprendre et à exécuter.
- Risque maîtrisé : en fixant des conditions claires d'entrée et de sortie, le risque est efficacement contrôlé.
- Forte flexibilité : prend en charge plusieurs types de moyennes mobiles, permettant un changement flexible en fonction des conditions du marché.
- Adaptabilité : les bandes de Bollinger s'ajustent automatiquement aux fluctuations du marché pour adapter les zones de trading.
- Facile à optimiser : les paramètres sont hautement ajustables, ce qui facilite l'optimisation en fonction des différentes conditions de marché.
Risques de la stratégie
- Risque de marché en range : dans un marché latéral, des signaux de faux cassages fréquents peuvent se produire.
- Risque de continuation de tendance : une clôture prématurée peut faire manquer une tendance majeure.
- Sensibilité aux paramètres : des réglages différents des paramètres peuvent entraîner des performances très variables.
- Impact du slippage : dans les marchés à faible liquidité, un slippage important peut survenir.
- Risque systémique : dans des conditions de marché extrêmes, des stop-loss successifs peuvent se produire.
Pistes d'optimisation de la stratégie
- Introduire un indicateur de volume : confirmer la validité des signaux par le volume.
- Ajouter un filtre de tendance : combiner une analyse de tendance à plus long terme pour éviter les trades à contre-tendance.
- Optimiser le mécanisme de stop-loss : introduire un stop-loss dynamique pour améliorer l'efficacité de l'utilisation du capital.
- Améliorer la gestion des positions : ajuster dynamiquement la taille des positions en fonction de la volatilité du marché.
- Ajouter un indicateur de sentiment de marché : combiner d'autres indicateurs techniques pour améliorer la précision des signaux.
Résumé
Cette stratégie capture les opportunités de surachat et de survente du marché à l'aide du RSI, et combine plusieurs indicateurs techniques pour confirmer les signaux. Elle présente une bonne praticité et fiabilité. La conception de la stratégie intègre pleinement le contrôle des risques, et grâce à l'optimisation des paramètres et à la combinaison d'indicateurs, elle peut s'adapter à différents environnements de marché. Il est recommandé aux traders de réaliser des tests de backtesting approfondis avant une utilisation en trading réel et d'ajuster les paramètres en fonction des caractéristiques spécifiques du marché.
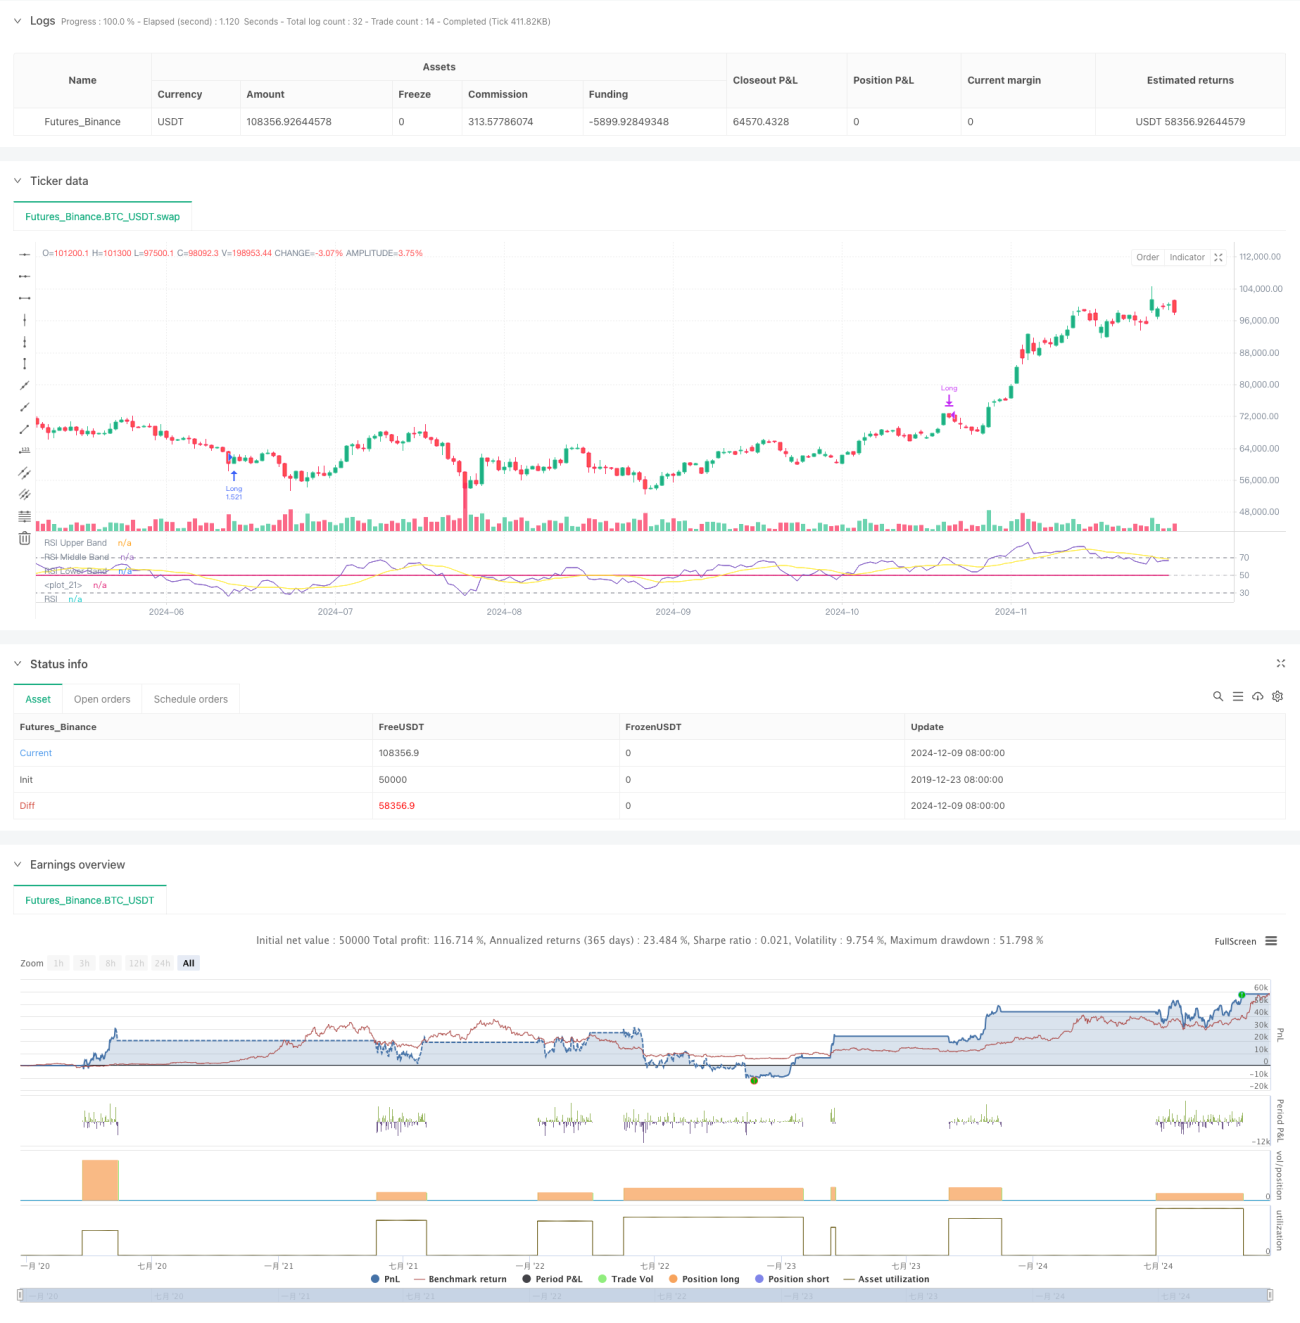
/*backtest
start: 2019-12-23 08:00:00
end: 2024-12-10 08:00:00
period: 1d
basePeriod: 1d
exchanges: [{"eid":"Futures_Binance","currency":"BTC_USDT"}]
*/

//@version=5
strategy(title="Demo GPT - Relative Strength Index", shorttitle="RSI Strategy", overlay=false, default_qty_type=strategy.percent_of_equity, default_qty_value=100, commission_value=0.1, slippage=3)

// Inputs- 1