Aperçu
La stratégie est un système de négociation complexe multi-indicateurs qui combine plusieurs indicateurs techniques tels que le RSI, le MACD, les moyennes mobiles (SMA) et d’autres pour identifier les opportunités de négociation en analysant les tendances et la dynamique des prix. La stratégie utilise la moyenne des 200 jours pour déterminer la tendance à long terme, la moyenne des 50 jours comme référence à la tendance à moyen terme et utilise les signaux croisés du RSI et du MACD au hasard pour confirmer le moment de la négociation.
Principe de stratégie
La logique fondamentale de la stratégie repose sur trois piliers principaux :
- Détermination de la tendance: utilisez la moyenne de 200 jours pour déterminer la direction de la tendance principale, le prix est tendance à la hausse au-dessus de la moyenne et à la baisse en dessous.
- Confirmation de la dynamique: La ligne %K et la ligne %D croisées à l’aide de l’indicateur RSI aléatoire ((SRSI) sont utilisées pour confirmer la dynamique des prix, et la dynamique haussière est indiquée lorsque la ligne %K traverse la ligne %D.
- Confirmation de la tendance: utilisation de l’indicateur MACD comme outil de confirmation de la tendance, la ligne MACD confirme la tendance haussière au-dessus de la ligne de signal.
Les conditions d’achat doivent être remplies à la fois :
- Le prix est au-dessus de la moyenne quotidienne de 200
- Le RSI au hasard traverse la ligne %D sur la ligne %K
- La ligne MACD est située au-dessus de la ligne de signal.
Les conditions de vente doivent être remplies:
- Les prix sont en dessous de la moyenne journalière de 200
- Le RSI au hasard traverse la ligne %D sous la ligne %K
- La ligne MACD est en dessous de la ligne de signal.
Avantages stratégiques
- Vérification multiple: réduit le risque de faux signaux grâce à l’utilisation combinée de plusieurs indicateurs techniques.
- Suivi des tendances: une combinaison de la moyenne à long terme et de la moyenne à moyen terme pour saisir efficacement les principales tendances.
- Identification de la dynamique: l’utilisation de RSI aléatoires permet de détecter plus tôt les points de retournement potentiels.
- Contrôle des risques: utilisation d’une moyenne de 50 jours comme référence de stop loss, fournissant un mécanisme de sortie clair.
- Fonctionnement systématique: la logique de la stratégie est claire, facilitant la mise en œuvre programmatique et la vérification de la rétroaction.
Risque stratégique
- Risque de retard: la moyenne mobile est essentiellement un indicateur de retard, ce qui peut entraîner des retards dans l’heure d’entrée et de sortie.
- Risque de marché oscillant: Dans un marché oscillant horizontalement, des indicateurs multiples peuvent générer des signaux de confusion.
- Risque de fausse rupture: le prix peut revenir rapidement après une courte rupture de la ligne moyenne, ce qui provoque un faux signal.
- Sensitivité des paramètres: les paramètres de plusieurs indicateurs doivent être optimisés pour différents environnements de marché.
- Signal conflit: différents indicateurs peuvent générer des signaux contradictoires, ce qui rend la prise de décision plus difficile.
Orientation de l’optimisation de la stratégie
Optimisation des paramètres de l’indicateur
- On peut tracer des cycles de moyennes mobiles optimaux à partir de données historiques.
- Optimiser les paramètres du RSI aléatoire pour s’adapter à différentes fluctuations du marché
Filtre de signaux:
- Ajouter un mécanisme de confirmation du volume
- Introduction d’indicateurs de volatilité et adaptation des stratégies de négociation pendant les périodes de forte volatilité
Amélioration de la gestion des risques:
- Mise en place d’un mécanisme de stop loss dynamique
- Taille de position ajustée en fonction de la dynamique des fluctuations du marché
Adaptation au marché:
- Ajout d’un mécanisme d’identification de l’environnement du marché
- Utilisation de paramètres différents dans différentes conditions de marché
Résumer
Il s’agit d’une stratégie de suivi de tendance systématique, qui utilise la combinaison de plusieurs indicateurs techniques, tout en garantissant la fiabilité des transactions. Le principal avantage de la stratégie réside dans son mécanisme de vérification à plusieurs niveaux, mais il faut également veiller à contrôler les risques de retard que peuvent entraîner plusieurs indicateurs.
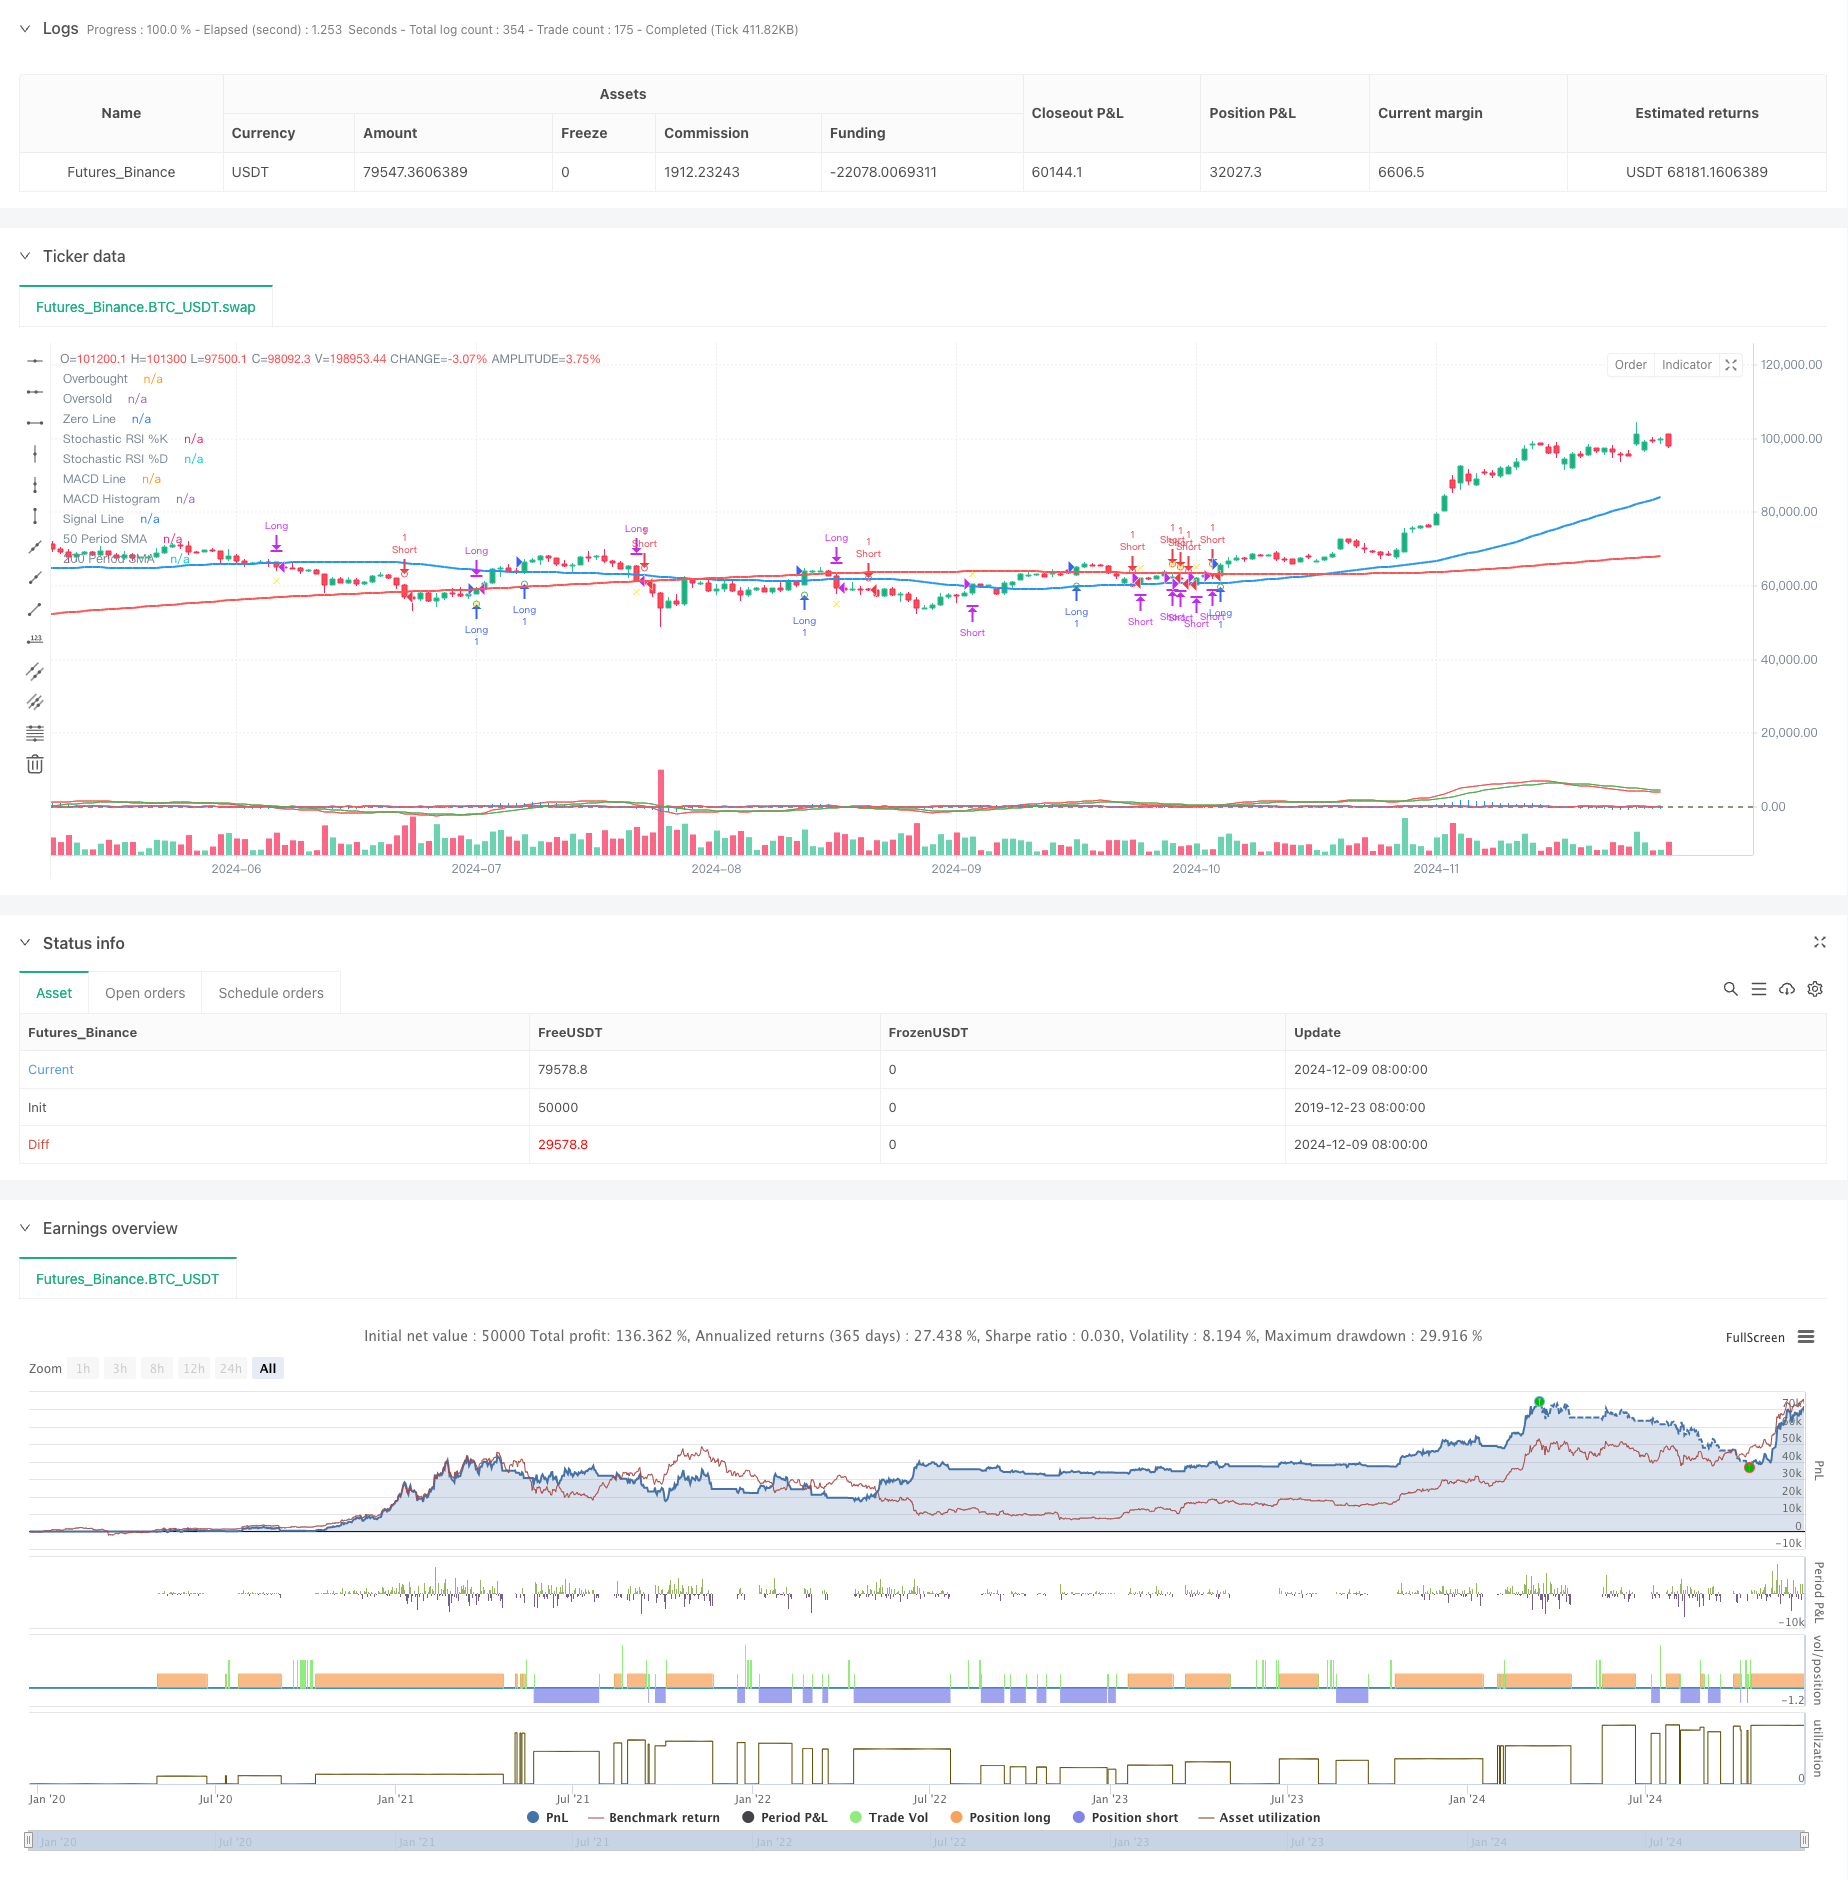
/*backtest
start: 2019-12-23 08:00:00
end: 2024-12-10 08:00:00
period: 1d
basePeriod: 1d
exchanges: [{"eid":"Futures_Binance","currency":"BTC_USDT"}]
*/

//@version=5
strategy("RSI and MACD by Karthik", overlay=true)

// Define periods for SMAs
sma50Period = 50
sma200Period = 200

// Calculate SMAs
sma50 = ta.sma(close, sma50Period)
sma200 = ta.sma(close, sma200Period)

// Plot SMAs on the main chart
plot(sma50, color=color.blue, title="50 Period SMA", linewidth=2)
plot(sma200, color=color.red, title="200 Period SMA", linewidth=2)

// Define and calculate parameters for Stochastic RSI
stochRSIPeriod = 14
rsi = ta.rsi(close, stochRSIPeriod)
stochRSIK = ta.stoch(rsi, rsi, stochRSIPeriod, 3)
stochRSID = ta.sma(stochRSIK, 3)

// Define and calculate parameters for MACD
macdShort = 12
macdLong = 26
macdSignal = 9
[macdLine, signalLine, macdHist] = ta.macd(close, macdShort, macdLong, macdSignal)

// Plot Stochastic RSI in a separate pane
hline(80, "Overbought", color=color.red, linewidth=1)
hline(20, "Oversold", color=color.green, linewidth=1)
plot(stochRSIK, color=color.blue, title="Stochastic RSI %K")
plot(stochRSID, color=color.red, title="Stochastic RSI %D")

// Plot MACD in a separate pane
hline(0, "Zero Line", color=color.gray, linewidth=1)
plot(macdHist, color=color.blue, title="MACD Histogram", style=plot.style_histogram)
plot(macdLine, color=color.red, title="MACD Line")
plot(signalLine, color=color.green, title="Signal Line")

// Conditions for buy and sell signals
isAbove200SMA = close > sma200
isStochRSIKAbove = stochRSIK > stochRSID
macdLineAbove = macdLine > signalLine
buySignal = isAbove200SMA and isStochRSIKAbove and macdLineAbove

isBelow200SMA = close < sma200
isStochRSIKBelow = stochRSIK < stochRSID
macdLineBelow = macdLine < signalLine
sellSignal = isBelow200SMA and isStochRSIKBelow and macdLineBelow

// Track the last signal with explicit type declaration
var string lastSignal = na

// Create series for plotting conditions
var bool plotBuySignal = na
var bool plotSellSignal = na
var bool plotExitBuySignal = na
var bool plotExitSellSignal = na

// Update plotting conditions based on signal and last signal
if buySignal and (lastSignal != "buy")
    plotBuySignal := true
    lastSignal := "buy"
else
    plotBuySignal := na

if sellSignal and (lastSignal != "sell")
    plotSellSignal := true
    lastSignal := "sell"
else
    plotSellSignal := na

// Update exit conditions based on SMA50
if lastSignal == "buy" and close < sma50
    plotExitBuySignal := true
    lastSignal := na // Clear lastSignal after exit
else
    plotExitBuySignal := na

if lastSignal == "sell" and close > sma50
    plotExitSellSignal := true
    lastSignal := na // Clear lastSignal after exit
else
    plotExitSellSignal := na

// Plot buy and sell signals on the main chart
plotshape(series=plotBuySignal, location=location.belowbar, color=color.green, style=shape.circle, size=size.small, title="Buy Signal")
plotshape(series=plotSellSignal, location=location.abovebar, color=color.red, style=shape.circle, size=size.small, title="Sell Signal")

// Plot exit signals for buy and sell
plotshape(series=plotExitBuySignal, location=location.belowbar, color=color.yellow, style=shape.xcross, size=size.small, title="Exit Buy Signal")
plotshape(series=plotExitSellSignal, location=location.abovebar, color=color.yellow, style=shape.xcross, size=size.small, title="Exit Sell Signal")


// Strategy to Backtest

long = buySignal
short = sellSignal

// Exit Conditions
exitBuy = close < sma50
exitSell = close > sma50


if (buySignal)
    strategy.entry("Long", strategy.long, 1.0)
if (sellSignal)
    strategy.entry("Short", strategy.short, 1.0)

strategy.close("Long", when=exitBuy)
strategy.close("Short", when=exitSell)