Stratégie de suivi de la volatilité dynamique des tendances multi-périodes

Aperçu
La stratégie est un système de suivi de tendance auto-adaptatif combinant plusieurs indicateurs techniques. Elle optimise la performance des transactions grâce à l'analyse multi-cycle et à l'ajustement dynamique des arrêts de perte. Le cœur de la stratégie est d'utiliser le système linéaire pour identifier les tendances, confirmer la force de la tendance via le RSI et le MACD et ajuster les paramètres de gestion des risques en fonction de la dynamique de l'ATR.
Principe de stratégie
La stratégie utilise un mécanisme de triple vérification pour la négociation: 1) la direction de la tendance est jugée par la croisée des EMA à des périodes rapides et lentes; 2) les signaux de négociation sont filtrés à l'aide de la confirmation de la tendance RSI sur les niveaux achat et vente et MACD; 3) la confirmation de la tendance est effectuée par l'introduction d'une EMA à des périodes plus longues. En termes de contrôle du risque, la stratégie réalise une gestion de position adaptative en ajustant les objectifs de perte et de profit en fonction de la dynamique ATR.
Avantages stratégiques
- Les mécanismes de vérification de signaux multidimensionnels améliorent considérablement la précision des transactions
- Les paramètres de freinage automatique sont mieux adaptés aux différents environnements de marché
- Les tendances à des périodes plus longues confirment efficacement le risque de fausses percées
- Un système d'alerte efficace pour saisir les opportunités et contrôler les risques
- Les réglages de direction de négociation flexibles permettent aux stratégies de s'adapter à différentes préférences de négociation
Risque stratégique
- Les mécanismes de multi-vérification peuvent vous faire rater des opportunités de rapidité.
- Dans un marché très volatile, les stop-loss dynamiques peuvent être déclenchés prématurément.
- Les faux signaux peuvent être fréquents dans les marchés de stockage horizontal.
- Il existe un risque de suradaptation dans l'optimisation des paramètres
- L'analyse multi-périodes peut présenter des signaux contradictoires à différentes périodes
Orientation de l'optimisation de la stratégie
- Introduction d'indicateurs de débit comme confirmation auxiliaire pour améliorer la fiabilité du signal
- Système de notation quantitative pour augmenter l'intensité des tendances et optimiser le moment d'entrée
- Développer des mécanismes d'optimisation des paramètres adaptatifs pour améliorer la stabilité de la stratégie
- Adhésion à un système de classification des environnements de marché avec différents paramètres pour différents marchés
- Développement d'un système de gestion de position dynamique qui ajuste les détentions en fonction de l'intensité du signal
Résumer
Il s'agit d'un système de suivi de tendance rigoureusement conçu, offrant une solution de négociation complète grâce à un mécanisme de vérification à plusieurs niveaux et à une gestion dynamique des risques. Les principaux avantages de la stratégie résident dans sa capacité d'adaptation et de contrôle des risques, mais il faut faire attention à l'optimisation des paramètres et à la correspondance avec l'environnement du marché.
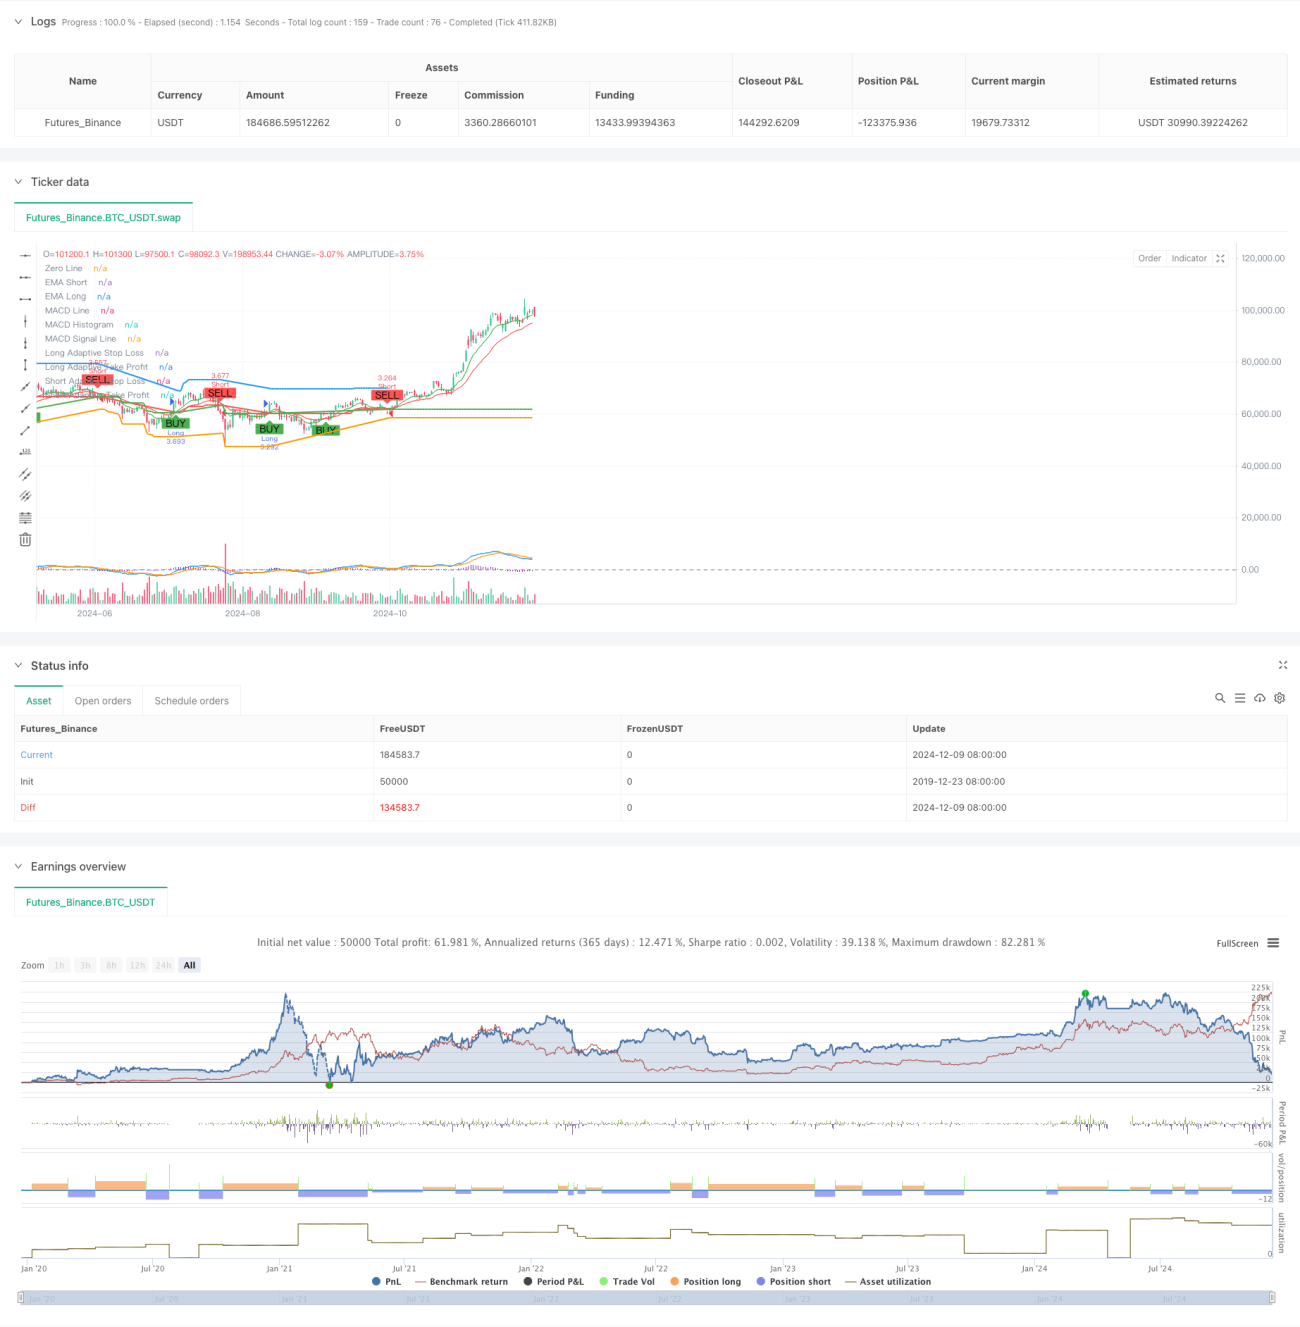
/*backtest
start: 2019-12-23 08:00:00
end: 2024-12-10 08:00:00
period: 1d
basePeriod: 1d
exchanges: [{"eid":"Futures_Binance","currency":"BTC_USDT"}]
*/

//@version=5
strategy("TrenGuard Adaptive ATR Strategy", overlay=true, default_qty_type=strategy.percent_of_equity, default_qty_value=100)

// Parameters- 1