Stratégie de retour à la moyenne avec bande de Bollinger

Aperçu
Cette stratégie est une stratégie d'investissement intelligente qui combine la loi du coût moyen en dollars (DCA) et les indicateurs techniques de la ceinture de Brin. Elle consiste à investir en utilisant le principe de la régression des valeurs moyennes en construisant systématiquement des positions pendant les retournements de prix.
Principe de stratégie
La stratégie est basée sur trois principes: 1) la méthode du coût moyen en dollars, qui réduit le risque d'optionalisation en investissant régulièrement des montants fixes; 2) la théorie du retour à la moyenne, qui considère que le prix reviendra à sa moyenne historique; 3) l'indicateur de la ceinture de Brin, qui est utilisé pour identifier les zones de survente. Lorsque le prix franchit la ceinture de Brin, le signal d'achat est déclenché.
Avantages stratégiques
- Réduire le risque de choix - réduire l'erreur humaine en achetant systématiquement plutôt qu'avec un jugement subjectif
- Capture d'opportunités de rebond - exécutez automatiquement des opérations d'achat lorsque le prix est en hausse
- Configuration de paramètres flexible - les paramètres et le montant de l'investissement peuvent être ajustés en fonction des différentes conditions du marché
- Des règles claires d'entrée et de sortie - des signaux objectifs basés sur des indicateurs techniques
- L'exécution automatisée - sans intervention humaine et évitant les transactions émotionnelles
Risque stratégique
- Risque d'échec de la régression de la moyenne - plus de faux signaux peuvent être générés dans un marché en tendance
- Risques de gestion des fonds - besoin de réserver suffisamment de fonds pour faire face à des signaux d'achat continus
- Risque d'optimisation des paramètres - une optimisation excessive peut entraîner l'échec de la stratégie
- Dépendance aux conditions du marché - risque de mauvaise performance dans des marchés très volatils
Il est recommandé d'adopter un système de gestion de fonds rigoureux et d'évaluer régulièrement la performance de la stratégie pour gérer ces risques.
Orientation de l'optimisation de la stratégie
- Introduire des filtres de tendance pour éviter les opérations de revers dans une tendance forte
- Ajout d'un mécanisme de confirmation de cycle de temps multiple
- Optimiser le système de gestion des fonds et ajuster les montants d'investissement en fonction de la dynamique des fluctuations
- Adhésion à un mécanisme de clôture des bénéfices, qui est clôturé lorsque le prix revient à la valeur moyenne
- Considérer d'améliorer la fiabilité du signal en combinaison avec d'autres indicateurs techniques
Résumer
Il s'agit d'une stratégie robuste qui combine l'analyse technique et une approche d'investissement systématisée. La stratégie est basée sur la reconnaissance des opportunités d'excédent et de baisse, en utilisant les méthodes de Brin, et sur la méthode du coût moyen en dollars pour réduire les risques. La clé du succès de la stratégie réside dans un réglage rationnel des paramètres et une discipline stricte d'exécution.
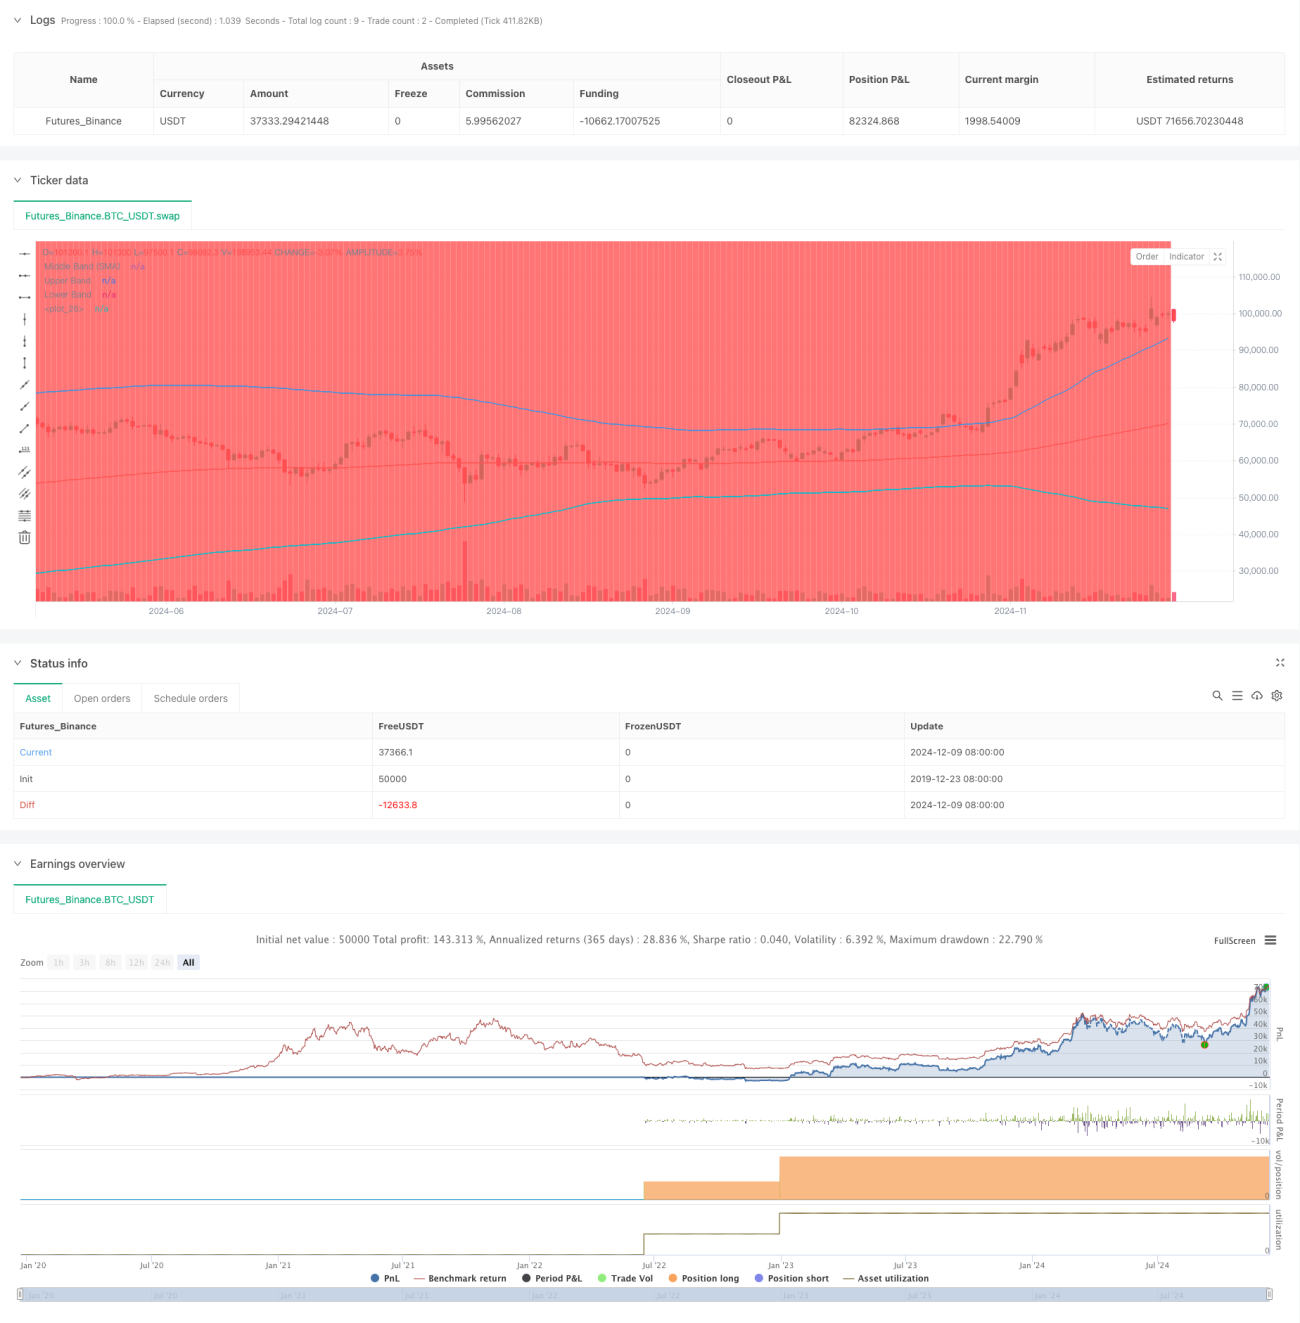
/*backtest
start: 2019-12-23 08:00:00
end: 2024-12-10 08:00:00
period: 1d
basePeriod: 1d
exchanges: [{"eid":"Futures_Binance","currency":"BTC_USDT"}]
*/

//@version=5
strategy("DCA Strategy with Mean Reversion and Bollinger Band", overlay=true) // Define the strategy name and set overlay=true to display on the main chart

// Inputs for investment amount and dates- 1