
Aperçu
La stratégie est un système de trading intégré combinant l'analyse des indicateurs de la force relative relative (RSI), de la dispersion de la convergence des moyennes mobiles (MACD), des bandes de Bryn (BB) et du volume (Volume). La stratégie est utilisée en combinaison avec des indicateurs techniques multidimensionnels pour effectuer une analyse complète des tendances du marché, de la volatilité et du volume, afin de trouver les meilleures opportunités de trading.
Principe de stratégie
La logique fondamentale de la stratégie repose sur les aspects suivants :
- Le RSI ((14) est utilisé pour juger si le marché est en sur-achat ou en sur-vente. Un RSI inférieur à 30 est considéré comme en sur-vente.
- Le MACD ((12,26,9) est utilisé pour déterminer la direction de la tendance, le MACD Gold Fork comme signal de multiplication
- Confirmer l'efficacité de la tendance des prix en calculant la différence entre le volume de transactions en hausse et en baisse (Delta Volume)
- Les prix de l'offre et de la vente sont évalués en fonction de la volatilité des prix et de l'optimisation des délais d'entrée.
- Le système émet le meilleur signal d'achat en cas de survente du RSI, de fourche MACD et de Delta Volume positif
- Lorsque le MACD dépasse 60 ou que le RSI dépasse 60, le système se stabilise automatiquement pour contrôler le risque.
Avantages stratégiques
- La vérification croisée multi-indicateurs améliore la fiabilité des signaux de trading
- L'efficacité des tendances des prix est confirmée par l'analyse des volumes de transactions
- Une sélection de types de moyennes mobiles adaptables, qui améliore la flexibilité de la stratégie
- Avoir un mécanisme de contrôle des risques bien développé, y compris des paramètres de stop-loss et de stop-loss
- Les paramètres de la stratégie peuvent être optimisés en fonction des différentes conditions du marché
Risque stratégique
- La combinaison de plusieurs indicateurs peut entraîner un retard de signal
- Des signaux erronés sur le marché horizontal
- Une optimisation excessive des paramètres peut conduire à un surapprentissage
- Les transactions à haute fréquence peuvent entraîner des coûts plus élevés
- Les plus fortes fluctuations du marché peuvent entraîner des retraits plus importants
Orientation de l'optimisation de la stratégie
- Introduction d'un mécanisme d'adaptation des paramètres afin de modifier les paramètres de l'indicateur en fonction de la dynamique du marché
- Augmentation des filtres d'intensité de tendance et diminution des faux signaux sur les marchés horizontaux
- Optimiser les mécanismes d'arrêt des pertes et améliorer l'efficacité de l'utilisation des fonds
- Ajout d'un mécanisme de filtrage de volatilité pour ajuster les positions dans un environnement à forte volatilité
- Développement d'un système de gestion de fonds intelligent permettant le contrôle dynamique des positions
Résumer
Il s'agit d'une stratégie de trading complexe qui intègre plusieurs indicateurs techniques et capte les opportunités de marché grâce à une analyse multidimensionnelle des RSI, MACD, volume de transaction, etc. La stratégie a une forte adaptabilité et une évolutivité, ainsi qu'un mécanisme de contrôle des risques. Grâce à une optimisation et à une amélioration continues, la stratégie devrait maintenir une performance stable dans différents environnements de marché.
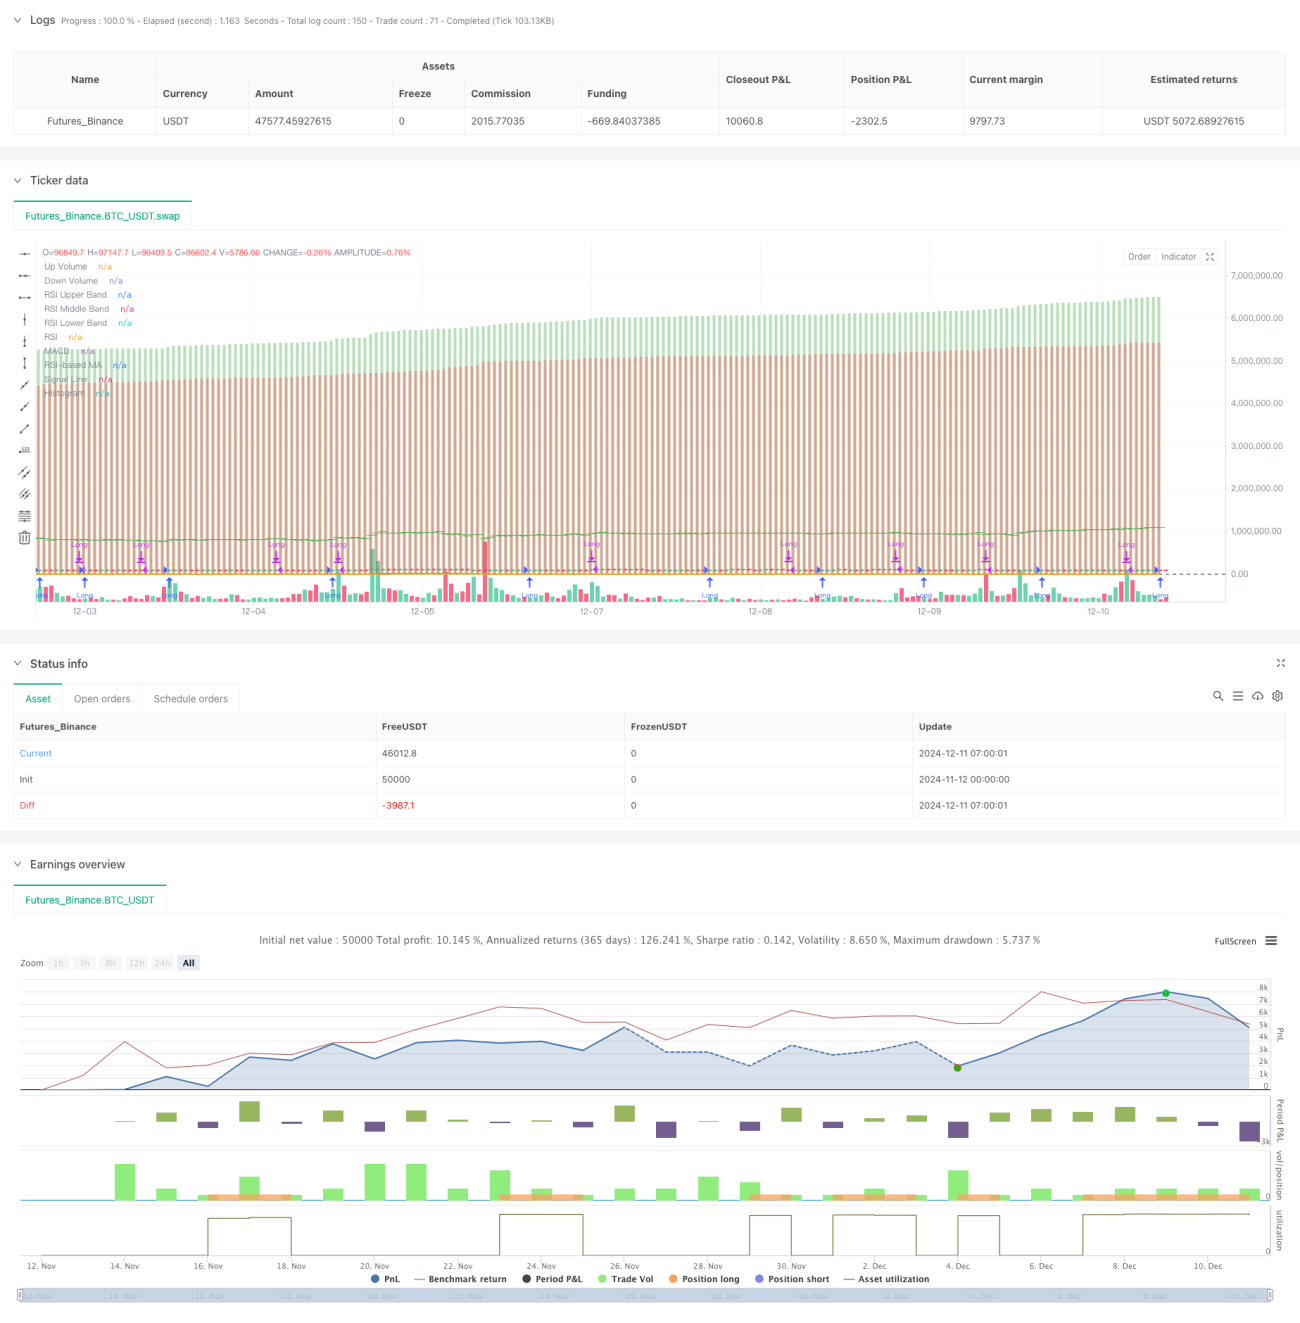
/*backtest
start: 2024-11-12 00:00:00
end: 2024-12-11 08:00:00
period: 1h
basePeriod: 1h
exchanges: [{"eid":"Futures_Binance","currency":"BTC_USDT"}]
*/

//@version=5
strategy("Liraz sh Strategy - RSI MACD Strategy with Bullish Engulfing and Net Volume", overlay=true, currency=currency.NONE, initial_capital=100000, commission_type=strategy.commission.percent, commission_value=0.1, slippage=3)

// Input parameters- 1