
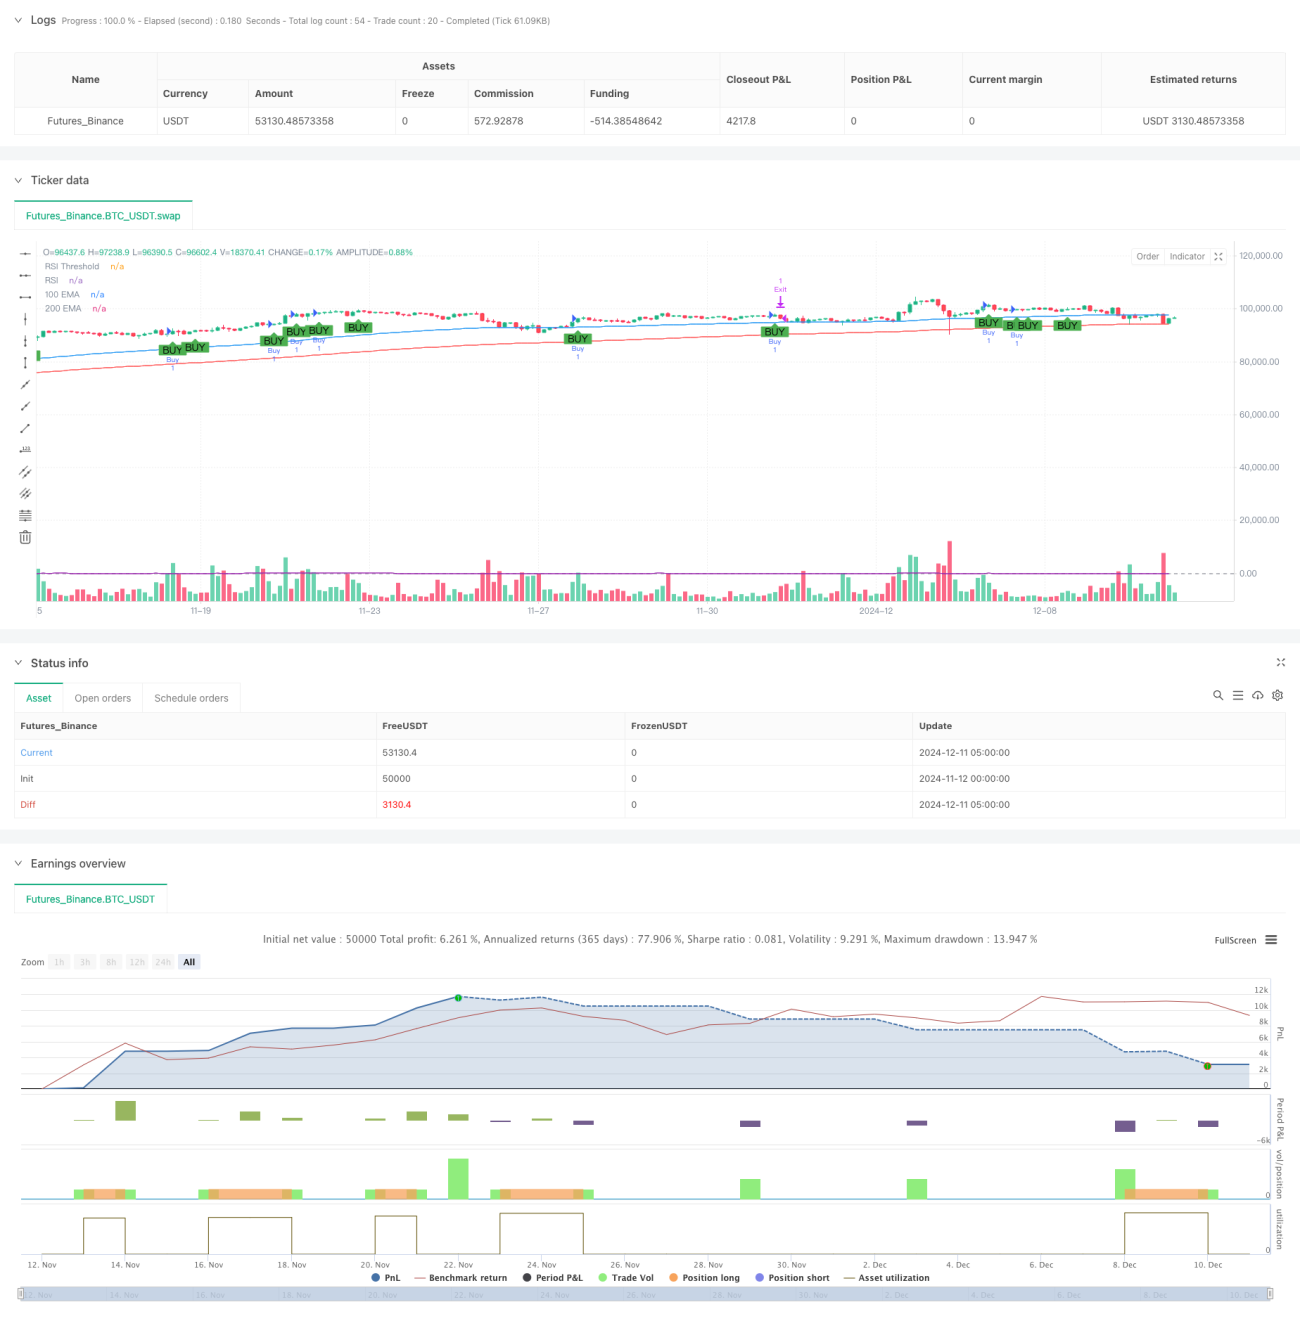
Aperçu
La stratégie est un système de suivi de tendance basé sur l'analyse technique, combinant le système de courbe, l'indicateur de dynamique RSI et l'indicateur de volatilité ATR, pour confirmer les opportunités de négociation par la vérification de signaux multiples. La stratégie utilise une courbe de courbe de croisement à plusieurs périodes pour juger de la tendance du marché, tout en combinant la dynamique RSI pour confirmer la force des prix, et finalement utiliser l'ATR pour définir des positions de stop-loss et de prise de profit, formant un système de négociation complet.
Principe de stratégie
La logique centrale de la stratégie comprend trois éléments clés:
- Détermination de la tendance: utilisez une moyenne mobile indicielle (EMA) de 100 cycles croisée avec une moyenne mobile indicielle de 200 cycles pour confirmer la direction de la tendance du marché. Lorsque l'EMA à court terme est au-dessus de l'EMA à long terme, cela indique que le marché est dans une tendance à la hausse.
- Signaux d'entrée: sur la base de la confirmation de la tendance, la stratégie recherche des formes de pénétration de bullish comme points d'entrée spécifiques et filtre le signal à l'aide de l'indicateur RSI. Lorsque le RSI est supérieur à 50, cela indique que le marché a suffisamment de dynamique haussière.
- Gestion des positions: utilisez l'ATR à 14 cycles pour mesurer la volatilité du marché et définissez dynamiquement les niveaux de stop loss et de profit. Le stop loss est fixé à 1,1 fois l'ATR et le profit est fixé à 2,0 fois l'ATR, ce qui garantit un ratio de profit / perte supérieur à 1
Avantages stratégiques
- Vérification de plusieurs signaux: réduit considérablement l'impact des faux signaux en combinant tendances, formes de prix et indicateurs de dynamique.
- Gestion dynamique des risques: paramétrage des pertes et des gains basé sur l'ATR, capable de s'adapter à la volatilité du marché et d'éviter les contraintes liées aux points fixes.
- Caractéristique de suivi des tendances: le système de courbe moyenne permet d'évaluer les tendances et d'éviter les transactions inutiles dans les marchés à la hausse ou à la baisse.
- Un cadre de négociation complet: un système stratégique complet pour la gestion des entrées, des sorties et des positions.
Risque stratégique
- Délai de tendance: l'EMA en tant qu'indicateur de retard peut entraîner un retard d'entrée et peut manquer le meilleur point d'entrée dans un marché en évolution rapide.
- Résolution des risques de marché: dans les marchés horizontaux, les croisements de courbe fréquents peuvent conduire à des transactions excessives.
- Risque de fausse rupture: La forme d'absorption de poissons peut entraîner une fausse rupture qui doit être gérée par un contrôle strict des risques.
- Risque de paramétrage d'arrêt: un nombre trop petit d'ATR peut entraîner un arrêt trop fréquent, tandis qu'un nombre trop grand d'ATR peut être exposé à un risque trop élevé.
Orientation de l'optimisation de la stratégie
- Introduction d'indicateurs de trafic: la fiabilité du signal peut être améliorée par l'ajout d'une confirmation de trafic.
- Optimisation des cycles de moyenne: les cycles de moyenne peuvent être ajustés en fonction des caractéristiques du marché pour mieux s'adapter au rythme du marché.
- Amélioration des mécanismes de stop loss: on peut envisager d'ajouter des stop loss mobiles, la protection est déjà rentable si la tendance se poursuit.
- Augmentation du filtrage des conditions de marché: introduction d'une marge de jugement sur les fluctuations afin de réduire la fréquence des transactions dans des conditions de marché trop volatiles.
- Optimiser les paramètres du RSI: recherchez les seuils et les périodes de calcul optimaux du RSI en fonction des données historiques.
Résumer
La stratégie a pour avantage de permettre la vérification de plusieurs signaux et la gestion dynamique des risques, mais elle doit également être attentive aux risques de retard de tendance et de faux-bris. La stratégie peut encore être améliorée en ajoutant la confirmation du volume, l'optimisation des paramètres, etc. Dans l'ensemble, la stratégie est adaptée pour fonctionner dans des marchés à tendance évidente et présente une bonne valeur d'application pour le suivi des tendances à moyen et long terme.
- 1