Stratégie de trading quantitative révolutionnaire avec triple écart type et bande de Bollinger combinée à une optimisation de la moyenne mobile sur 100 jours

Aperçu
Cette stratégie est une stratégie de trading quantitatif basée sur une rupture de la ceinture de Brin, utilisant une courbe supérieure de 3 fois l'écart standard et une courbe inférieure de 1 fois l'écart standard, tout en combinant la moyenne mobile à 100 jours comme courbe intermédiaire. La stratégie est principalement conçue pour capturer les tendances à long terme en détectant les ruptures de prix et en utilisant les ruptures de prix comme signal d'arrêt.
Principe de stratégie
Le principe central de la stratégie est basé sur les caractéristiques statistiques de la ceinture de Brin. L'écart standard de 3 fois est utilisé dans la voie supérieure, ce qui signifie que la probabilité de rupture de la voie supérieure n'est que de 0,15% dans le cas d'une distribution normale, de sorte que la formation d'une tendance significative est souvent annoncée lorsque la rupture se produit.
Avantages stratégiques
- La capacité à saisir les tendances est élevée: avec des réglages à 3 fois le décalage standard, il est possible de saisir efficacement les opportunités de rupture de tendances importantes.
- Le contrôle des risques est raisonnable: un écart standard de 1 fois est utilisé comme ligne de stop-loss et le contrôle des risques est plus conservateur.
- Les paramètres sont très réglables: les périodes de variation standard et de moyenne mobile peuvent être ajustées en fonction des différentes caractéristiques du marché.
- Systématique: logique stratégique claire, fonction de rétroaction parfaite, performance statistique précise.
- Large adaptabilité: peut être appliqué dans plusieurs domaines tels que le marché boursier et le marché des crypto-monnaies.
Risque stratégique
- Risque de fausse percée: le marché peut se retourner rapidement après une percée de courte durée, ce qui conduit à de faux signaux.
- Un retrait plus important: un retrait plus important peut survenir dans un marché très volatil.
- Risque de retard: la ligne moyenne de 100 jours présente un certain retard et risque de manquer des événements rapides.
- Dépendance aux conditions du marché: les entrées et les sorties peuvent être fréquentes dans les marchés instables, ce qui entraîne des coûts de transaction excessifs.
Orientation de l'optimisation de la stratégie
- Introduction de la confirmation de la quantité de transaction: un mécanisme de confirmation de la rupture de la quantité de transaction peut être ajouté pour améliorer la fiabilité du signal.
- Optimisation des mécanismes d'arrêt des pertes: l'introduction d'un arrêt de suivi ou d'un arrêt ATR dynamique peut être envisagée pour améliorer la flexibilité de l'arrêt des pertes.
- Ajout de filtres de tendance: vous pouvez ajouter des indicateurs de tendance à long terme et ne négocier que dans la direction de la tendance principale.
- Optimisation de la gestion des positions: la taille des positions peut être ajustée en fonction de la dynamique de la force de rupture.
- Ajout d'un filtre temporel permettant d'éviter certaines périodes de marché.
Résumer
Il s'agit d'une stratégie de suivi de tendance conçue de manière rationnelle et logique. Grâce aux caractéristiques statistiques des bandes de blur et aux caractéristiques de suivi de tendance des moyennes mobiles, il est possible de capturer efficacement des opportunités de percée importantes sur le marché. Bien qu'il existe un certain risque de retrait, il a toujours une bonne valeur pratique grâce à un réglage et un contrôle des risques raisonnables.
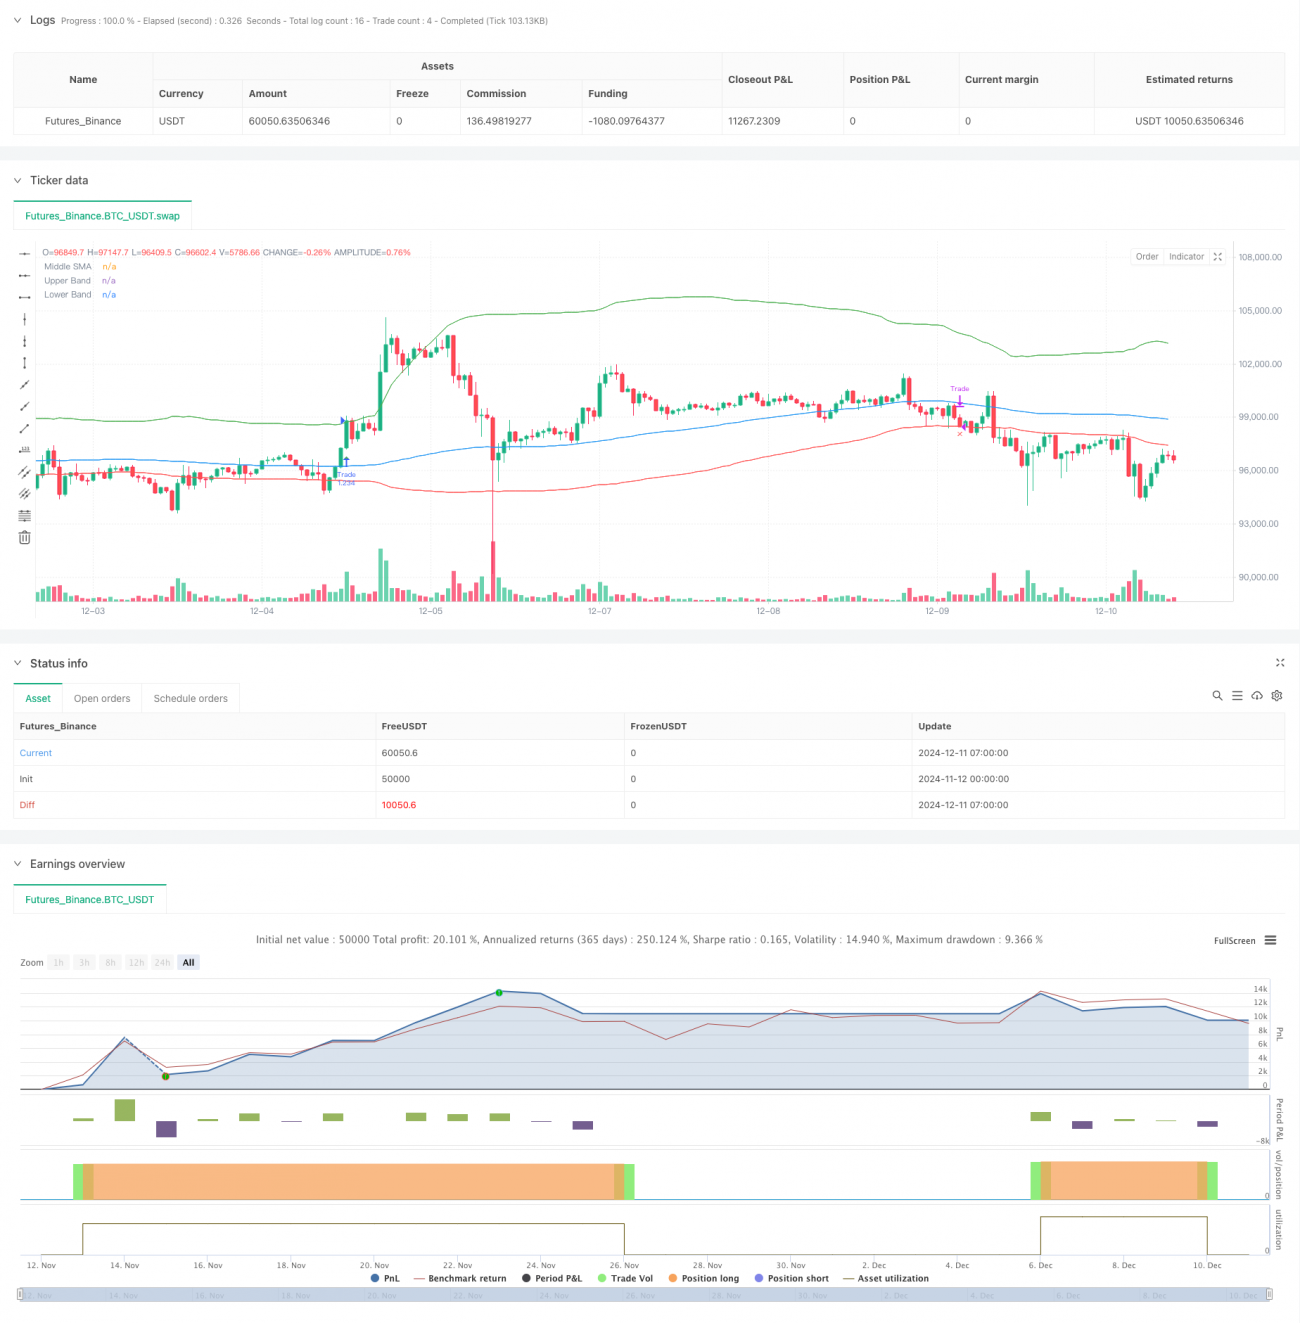
/*backtest
start: 2024-11-12 00:00:00
end: 2024-12-11 08:00:00
period: 1h
basePeriod: 1h
exchanges: [{"eid":"Futures_Binance","currency":"BTC_USDT"}]
*/

// This Pine Script™ code is subject to the terms of the Mozilla Public License 2.0 at https://mozilla.org/MPL/2.0/
// © MounirTrades007

// @version=6- 1