
Aperçu
La stratégie est un système de trading de rupture de momentum basé sur les bandes de Bollinger, principalement pour capturer les opportunités de tendance par la relation entre les prix et les bandes de Bollinger. La stratégie utilise un mécanisme de sélection de type homogène adaptatif, combiné à un canal de différence standard pour identifier les caractéristiques de la volatilité du marché, particulièrement adapté aux environnements de marché très volatils.
Principe de stratégie
La logique fondamentale de la stratégie repose sur les éléments clés suivants :
- La moyenne des bandes de Bollinger est calculée à l'aide de moyennes mobiles personnalisables (incluant SMA, EMA, SMMA, WMA et VWMA).
- La dynamique d'ascension et de descente est déterminée par le multiplicateur de la différence standard (default 2.0) [2].
- La hausse de l'entrée au moment où le prix se dégage montre la formation d'une forte tendance à la rupture.
- Lorsque le prix est descendu en dessous de la trajectoire, il est possible que la tendance à la hausse soit terminée.
- Le système prend en compte le coût de transaction ((0,1%) et le point de glissement ((3 points), ce qui correspond mieux à l'environnement de transaction réel.
Avantages stratégiques
- Adaptabilité: les stratégies peuvent s'adapter aux différentes conditions du marché en choisissant plusieurs types de ligne moyenne.
- Le contrôle des risques est amélioré: un contrôle des risques clair est fourni par le fait que la piste de descente de la Bollinger est un point d'arrêt.
- La gestion des fonds est rationnelle: la gestion des positions est proportionnelle, ce qui évite les risques liés à la main fixe.
- Le coût de transaction est bien pris en compte: les commissions et les points de glissement sont inclus, ce qui rend les résultats de la rétro-évaluation plus proches de la réalité.
- Flexibilité du calendrier: les paramètres permettent de choisir un calendrier spécifique.
Risque stratégique
- Risque de fausse rupture: Les signaux de fausse rupture peuvent être fréquents dans les marchés en crise.
Solution: ajouter des indicateurs de confirmation ou un mécanisme de retard d'entrée. - Risque de renversement de tendance: une forte tendance peut entraîner des pertes importantes si le marché se retourne brusquement.
Solution: Vous pouvez ajouter un filtre de force de tendance. - Sensibilité des paramètres : différentes combinaisons de paramètres peuvent entraîner de grandes différences dans les performances de la stratégie.
Solution: Optimisation des paramètres et tests de robustesse sont nécessaires.
Orientation de l'optimisation de la stratégie
- Les indicateurs d'intensité de la tendance ont été introduits:
- Les signaux de faibles tendances peuvent être filtrés par l'ajout d'un indicateur ADX ou similaire.
- Cela réduirait les dommages causés par les fausses brèches.
- Optimiser les mécanismes de coupe des pertes:
- Il est possible de réaliser un arrêt dynamique, comme un arrêt de suivi.
- Il est possible de bénéficier d'une augmentation des revenus si la tendance se maintient.
- Ajout de filtres de transaction:
- Signaux de confirmation basés sur le volume des transactions
- Évitez de négocier dans un environnement à faible liquidité
- Les résultats de l'enquête ont été publiés dans les médias sociaux.
- Des mécanismes permettant d'augmenter la réintégration
- Pour obtenir un meilleur prix d'entrée
Résumer
Il s'agit d'une stratégie de suivi de tendance conçue de manière rationnelle et logique. Elle capte la dynamique du marché grâce aux caractéristiques dynamiques des bandes de Bollinger et dispose d'un bon mécanisme de contrôle des risques.
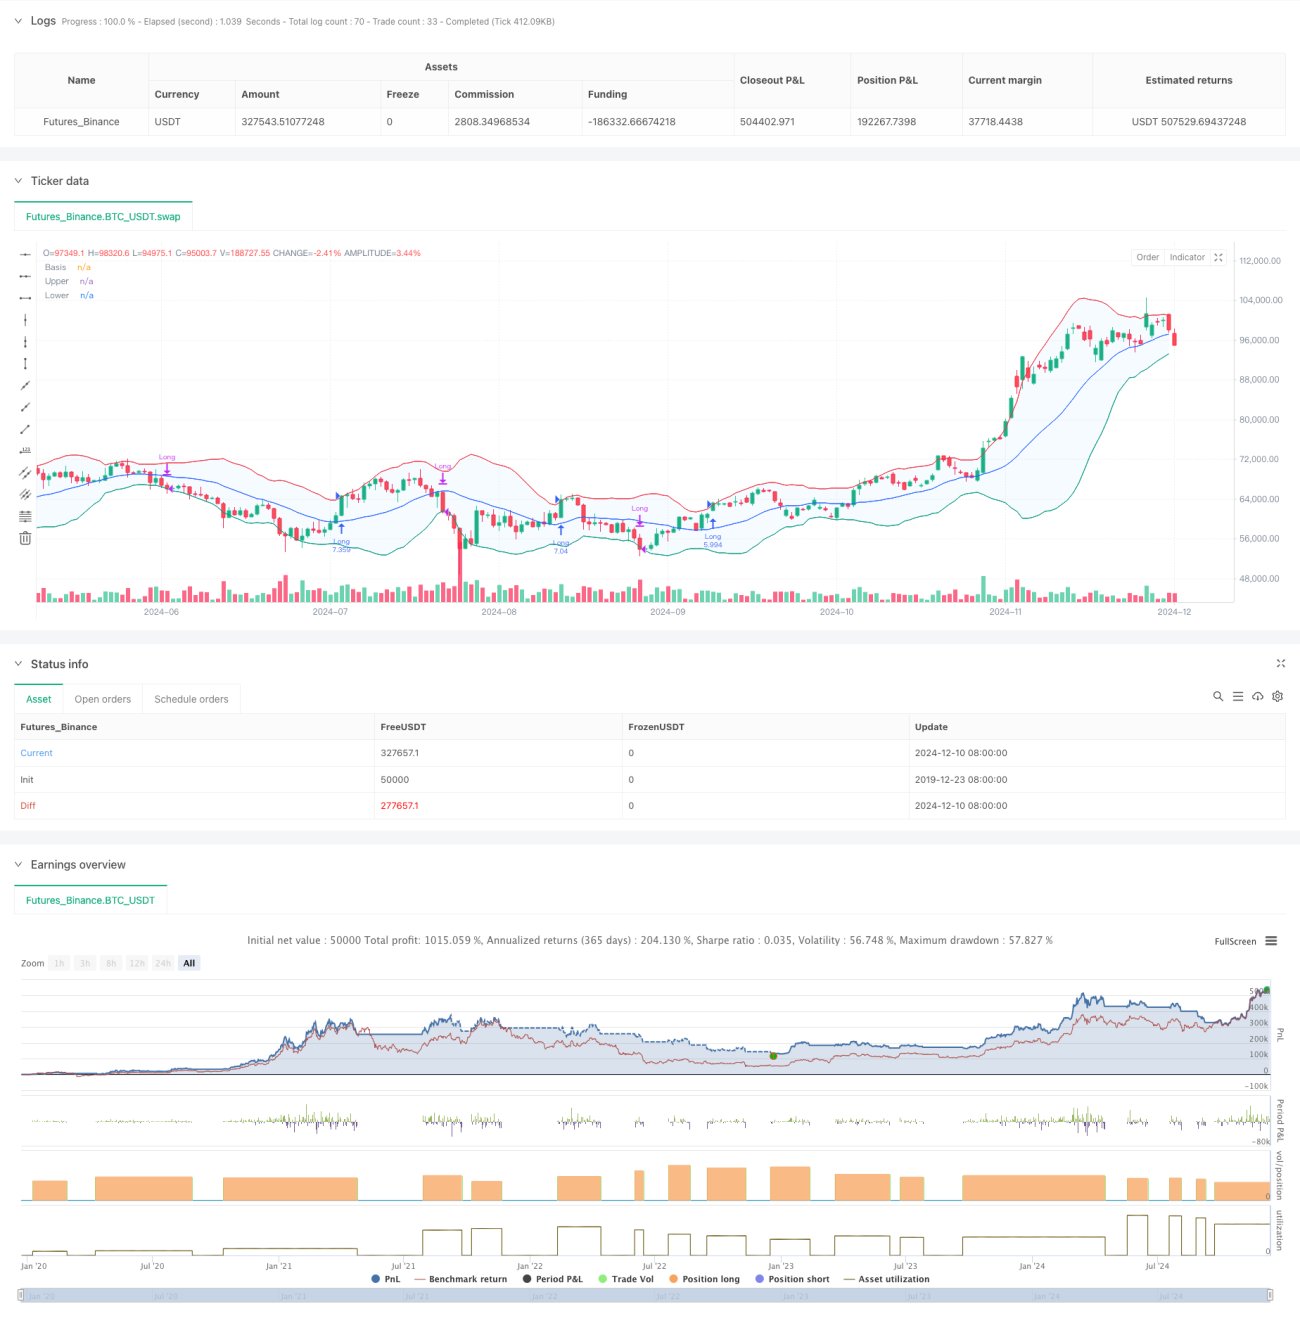
/*backtest
start: 2019-12-23 08:00:00
end: 2024-12-11 08:00:00
period: 1d
basePeriod: 1d
exchanges: [{"eid":"Futures_Binance","currency":"BTC_USDT"}]
*/

//@version=5
strategy("Demo GPT - Bollinger Bands", overlay=true, initial_capital=10000, commission_type=strategy.commission.percent, commission_value=0.1, slippage=3, default_qty_type=strategy.percent_of_equity, default_qty_value=100)

// Inputs- 1