
Aperçu de la stratégie
Il s'agit d'une stratégie de trading intelligente qui combine les bandes de Brin et les indicateurs de tendance supérieure. Cette stratégie consiste principalement à identifier les intervalles de fluctuation du marché via les bandes de Brin, tout en utilisant les indicateurs de tendance supérieure pour confirmer la direction de la tendance du marché, ce qui permet de négocier dans des positions à forte probabilité. La stratégie est conçue pour une variété de types de transactions et de périodes de temps, et fonctionne particulièrement bien sur les périodes de 30 minutes et 2 heures.
Principe de stratégie
La logique fondamentale de la stratégie repose sur les éléments clés suivants :
- Utilisation d'une bande de Brin à 20 cycles, avec une bande passante de 2 écarts standards, constituée d'une voie supérieure, d'une voie intermédiaire, d'une voie inférieure et de deux lignes centrales
- Indicateur de super-tendance avec un ATR à 10 cycles et un facteur de multiplication par 3
- Signal d'entrée:
- Entrée à plusieurs têtes: lorsque le prix touche la bande de Brent et que l'indicateur de tendance est à plusieurs têtes
- Entrée à la tête nue: lorsque le prix touche la courbe de Brin et que l'indicateur de tendance supérieure est à la tête nue
- Le signal de sortie:
- sortie à plusieurs têtes: lorsque le prix de clôture tombe en dessous de la ligne de tendance supérieure et que la tendance se retourne à la hausse
- Sortie en tête nue: lorsque le cours de clôture franchit la ligne de tendance supérieure et que la tendance se transforme en tête nue
Avantages stratégiques
- Le mécanisme de double confirmation augmente la fiabilité des transactions: la combinaison de la zone de volatilité de la ceinture de Brin et la direction de la super tendance réduit efficacement le risque de fausse rupture
- Adaptation aux fluctuations du marché: les bandes Brin s'adaptent automatiquement en fonction des fluctuations du marché, ce qui rend la stratégie très adaptable
- Signaux d'échange clairs: les conditions d'entrée et de sortie sont claires, faciles à exécuter et à remonter
- Configuration de paramètres flexible: la longueur de bande de Brin, le multiplicateur de bande passante et les paramètres de super-tendance peuvent être ajustés en fonction des conditions du marché
- Excellent visualisation: marquage des signaux de transaction en différentes couleurs et formes pour faciliter l'analyse et la surveillance
Risque stratégique
- Risque de choc: les faux signaux peuvent apparaître fréquemment dans des situations de choc horizontal
- Risque de retard: les courbes de Bryn et les supertrends sont des indicateurs de retard qui peuvent manquer les meilleurs points d'entrée dans un mouvement rapide
- Sensibilité des paramètres : Différents réglages de paramètres peuvent entraîner de grandes différences dans les performances de la stratégie
Il est recommandé de contrôler les risques suivants:
- La mise en place d'une position de stop-loss pour contrôler le risque individuel
- Considérer la suspension des transactions pendant une période de forte volatilité
- Optimiser régulièrement les paramètres pour s'adapter aux changements du marché
Orientation de l'optimisation de la stratégie
- Le filtrage de la volatilité du marché:
- Ajustement de la taille de la position dans un environnement à forte volatilité
- Ajout d'un filtre ATR pour éviter les transactions sur une période de forte volatilité
- Le système de prévention des pertes est amélioré:
- Placement de stop-loss basé sur la bande passante dynamique de Brin
- Stratégie d'arrêt dynamique de conception combinée à une inclinaison de tendance supérieure
- Ajouter un filtrage temporel:
- Éviter de publier des données importantes à un moment donné
- Configurer des paramètres différents pour différentes périodes
- Optimisation du mécanisme de confirmation du signal:
- Confirmation d'augmentation du volume
- Considérer d'augmenter les indicateurs de force de tendance
Résumer
Il s'agit d'un système de trading complet combinant des indicateurs classiques de l'analyse technique, capable de bien fonctionner dans les tendances et les fluctuations grâce à la synergie des bandes de Bryn et des supertrends. La conception visuelle et la flexibilité des paramètres de la stratégie la rendent très pratique.
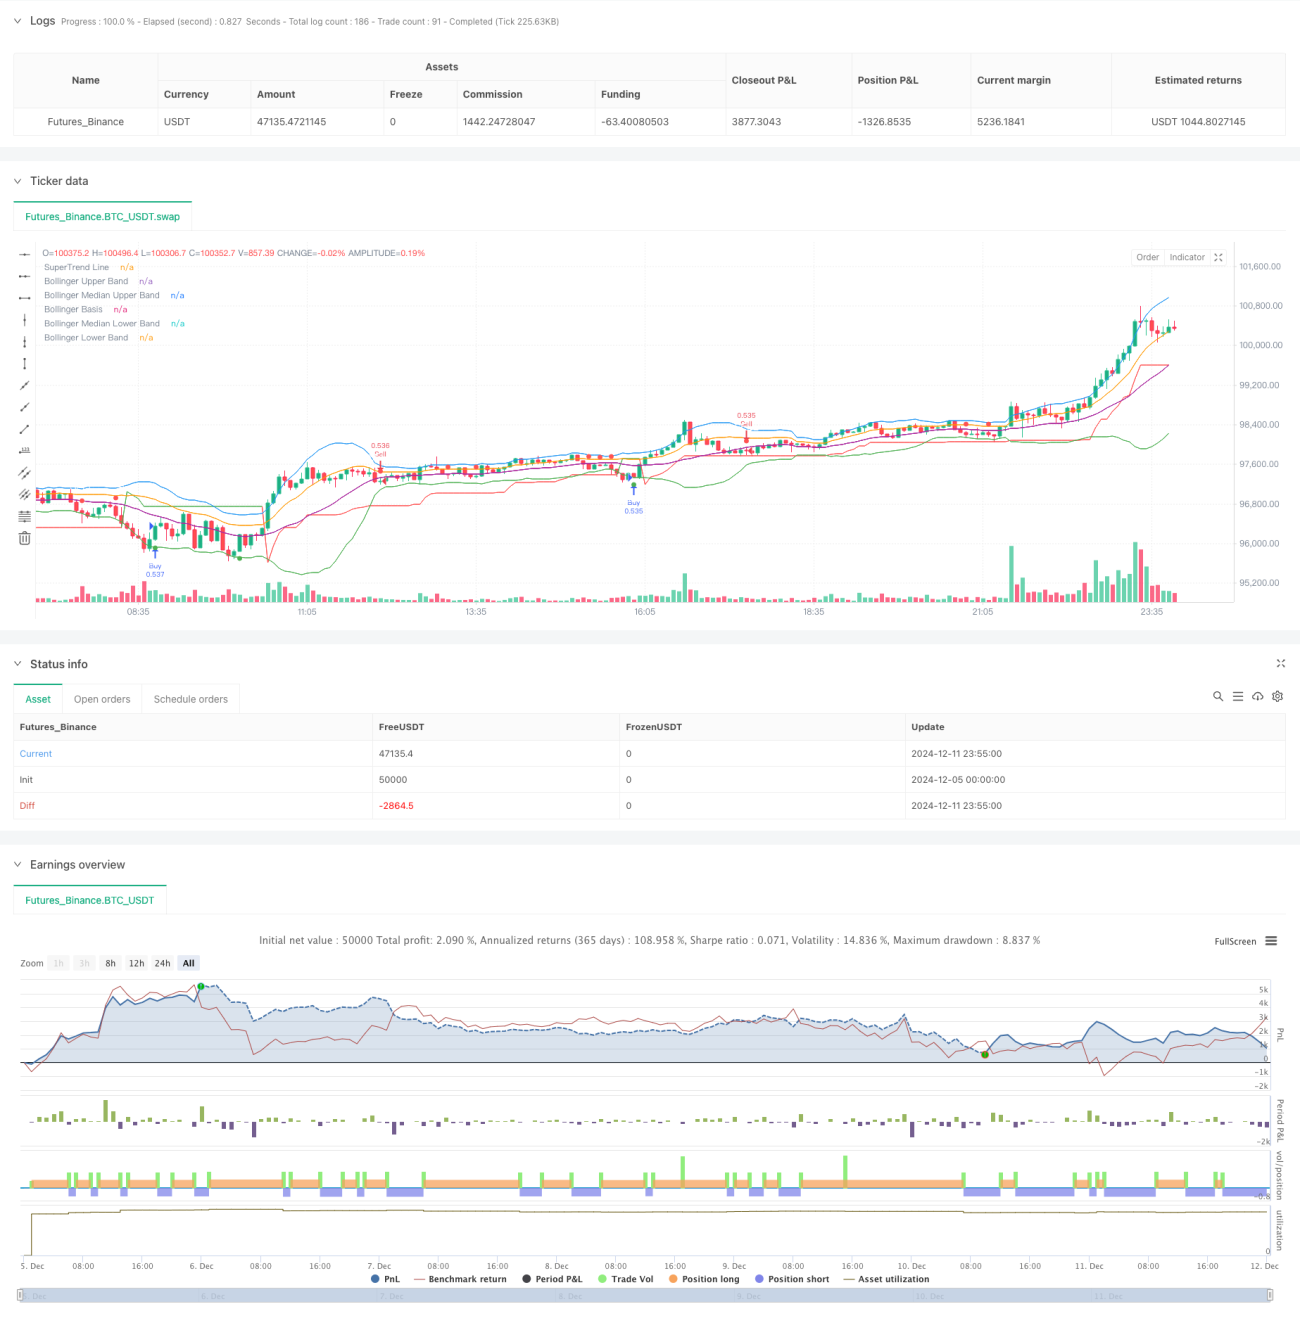
/*backtest
start: 2024-12-05 00:00:00
end: 2024-12-12 00:00:00
period: 5m
basePeriod: 5m
exchanges: [{"eid":"Futures_Binance","currency":"BTC_USDT"}]
*/

//@version=5
strategy("Bollinger Band & SuperTrend Strategy (Standard Chart)", overlay=true, default_qty_type=strategy.percent_of_equity, default_qty_value=100)

// Bollinger Bands Settings- 1