
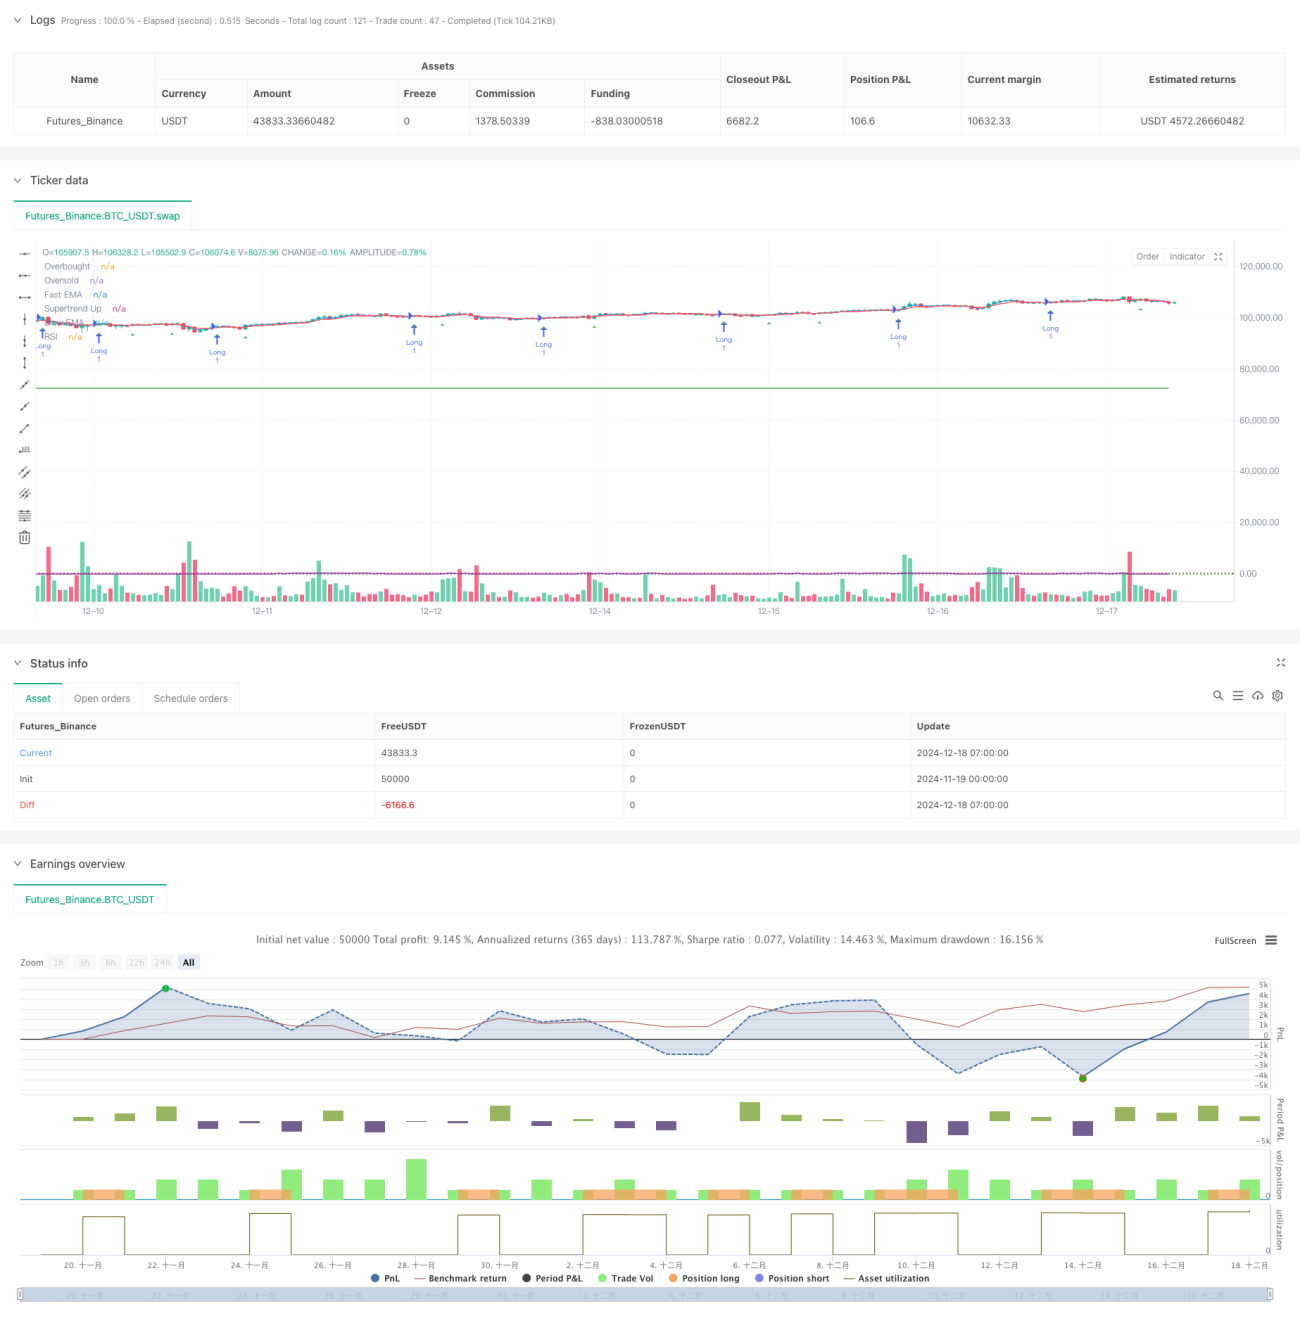
Aperçu
Il s'agit d'une stratégie de suivi de tendance combinant plusieurs indicateurs techniques, utilisant principalement des indices rapides et lents comme les moyennes mobiles (EMA) croisées, les indicateurs de tendance Supertrend et les indicateurs relativement faibles (RSI) pour identifier les opportunités de négociation. La stratégie utilise une combinaison organique d'indicateurs pour augmenter le filtrage de la dynamique sur la base du suivi de la tendance, tout en utilisant ATR pour ajuster dynamiquement les positions de stop-loss.
Principe de stratégie
La stratégie utilise un triple mécanisme de filtrage pour identifier les signaux de transaction:
- Le système de croisement EMA est utilisé pour capturer les changements de tendance à court terme, en produisant un signal de multiplication lorsque l'EMA rapide est traversée par l'EMA lente et un signal de blanchiment lorsque l'EMA lente est traversée.
- L'indicateur de Supertrend est basé sur le calcul ATR de la ligne de support / résistance dynamique pour confirmer la direction de la tendance globale. Le surplus est autorisé uniquement lorsque le prix est au-dessus de la ligne de Supertrend et le creux est autorisé lorsque le prix est en dessous de la ligne.
- L'indicateur RSI est utilisé pour filtrer les conditions de marché où il y a trop de vente ou trop de vente. Un surplus est autorisé lorsque le RSI n'atteint pas la zone de survente et un vide lorsque le RSI n'atteint pas la zone de survente.
La stratégie contient également un système de stop-loss dynamique basé sur l'ATR, qui permet d'ajuster automatiquement les paramètres de gestion des risques en fonction de la volatilité du marché. En même temps, le filtrage temporel limite les périodes de négociation afin d'éviter les transactions pendant les périodes de faible liquidité.
Avantages stratégiques
- La combinaison de plusieurs indicateurs techniques fournit des signaux de négociation plus fiables, évitant les faux signaux qu'un seul indicateur pourrait apporter.
- Les paramètres de stop-loss dynamiques s'adaptent aux différentes conditions de volatilité du marché, donnant plus de marge de manœuvre aux transactions lorsque la volatilité est plus élevée.
- Le mécanisme de filtrage du RSI réduit efficacement le risque d'entrée dans des conditions extrêmes du marché.
- La fonction de filtrage temporel permet aux traders de se concentrer sur des périodes de trading spécifiques et d'éviter les périodes de trading inefficaces.
Risque stratégique
- Les conditions de filtrage multiples peuvent entraîner la perte d'opportunités de négociation potentielles.
- Dans un marché en évolution rapide, le stop loss peut être facilement touché.
- L'optimisation excessive des paramètres peut entraîner des problèmes de suradaptation.
- Les transactions à haute fréquence peuvent entraîner des coûts de transaction plus élevés.
Orientation de l'optimisation de la stratégie
- L'augmentation de l'indicateur de conversion peut être envisagée comme confirmation supplémentaire.
- L'introduction d'un mécanisme d'ajustement des paramètres adaptatifs permet aux stratégies de mieux s'adapter aux différents environnements du marché.
- Ajout d'un filtre de force de tendance pour éviter de trop négocier dans un marché en faible tendance.
- Développer un système de gestion des positions plus intelligent, qui ajuste le ratio de détention en fonction de la dynamique du marché.
Résumer
La stratégie construit un système de trading relativement complet en combinant plusieurs indicateurs techniques et conditions de filtrage. Son avantage central réside dans les mécanismes de confirmation multiple et la gestion dynamique des risques, mais il faut également prêter attention à des questions telles que l'optimisation des paramètres et les coûts de transaction. Grâce à une optimisation et à une amélioration continues, la stratégie devrait maintenir une performance stable dans différents environnements de marché.
- 1