Aperçu
La stratégie est un système de négociation basé sur une moyenne mobile à 14 cycles (EMA), combinant l’analyse de la forme du graphique et les caractéristiques de la dynamique des prix. La stratégie identifie les signaux de négociation en analysant la relation croisée du prix avec l’EMA, tout en tenant compte des caractéristiques de la forme du graphique (par exemple, le rapport entre l’entité et l’ombre) afin de capturer les points de changement de la tendance du marché.
Principe de stratégie
La logique fondamentale de la stratégie repose sur les éléments clés suivants :
- Confirmation de rupture de l’EMA: utilisation de l’EMA à 14 cycles comme support et résistance dynamiques.
- Une analyse du graphisme:
- Les conditions d’achat sont les suivantes (prix de clôture supérieur au prix d’ouverture)
- Les conditions de vente sont les suivantes: (prix de clôture inférieur au prix d’ouverture)
- Les prix ont été vérifiés:
- L’achat exige qu’au moins 50% de la quantité de lithium soit passée par l’EMA.
- Il faut que le prix tombe complètement sous l’EMA pour vendre.
- Contrôle de la proportion de la ligne d’ombre:
- L’achat de signaux exige que le total des lignes d’ombrage ne dépasse pas 40% de la longueur totale du câble
- Vendre un signal limité à 20% de la longueur totale du câble
Avantages stratégiques
- Contrôle rigoureux de la qualité du signal: réduction des risques de fausses interceptions grâce à une vérification multi-conditions
- Reconnaissance précise des formes: analyse de la proportion entre les entités de la carte et les lignes d’ombre, amélioration de la fiabilité du signal
- Une forte capacité de suivi des tendances: les caractéristiques dynamiques de l’EMA permettent de suivre efficacement les tendances du marché
- Contrôle des risques: réduire les risques de transaction grâce à un contrôle strict des ratios de ligne d’ombre
- Adaptabilité: les paramètres de la stratégie peuvent être ajustés de manière flexible en fonction des différentes conditions du marché
Risque stratégique
- Risque de marché horizontal: les faux signaux peuvent être fréquents dans les marchés en mouvement
- Risque de retard: l’indicateur EMA lui-même présente un certain retard et risque de manquer les meilleurs points d’entrée
- Risque de gap: le saut en hauteur peut entraîner une panne d’arrêt
- Sensibilité des paramètres: les paramètres peuvent être ajustés pour maintenir l’efficacité de la stratégie dans différents environnements de marché
Orientation de l’optimisation de la stratégie
- Le filtrage des fluctuations:
- Ajout d’un indicateur ATR pour évaluer les fluctuations du marché
- Augmentation du seuil de confirmation du signal pendant les périodes de forte volatilité
- Vérification à cycles multiples:
- Confirmation de la tendance à l’augmentation des périodes de temps
- Mise en place d’un mécanisme de vérification de la cohérence des signaux à cycles multiples
- Optimisation dynamique des paramètres :
- Adaptation dynamique des cycles EMA en fonction des fluctuations du marché
- Adaptation de la valeur limite de proportion de la ligne d’ombre
- Optimisation de la gestion des positions:
- Système de position dynamique conçu en fonction des fluctuations du marché
- La mise en place d’une pyramide d’accréditation
Résumer
La stratégie utilise l’analyse intégrée des EMA, des modèles graphiques et des comportements des prix pour construire un système de négociation complet. L’avantage de la stratégie réside dans la rigueur de la confirmation des signaux et la perfection du contrôle des risques, mais il faut également tenir compte de l’impact de l’environnement du marché sur la performance de la stratégie.
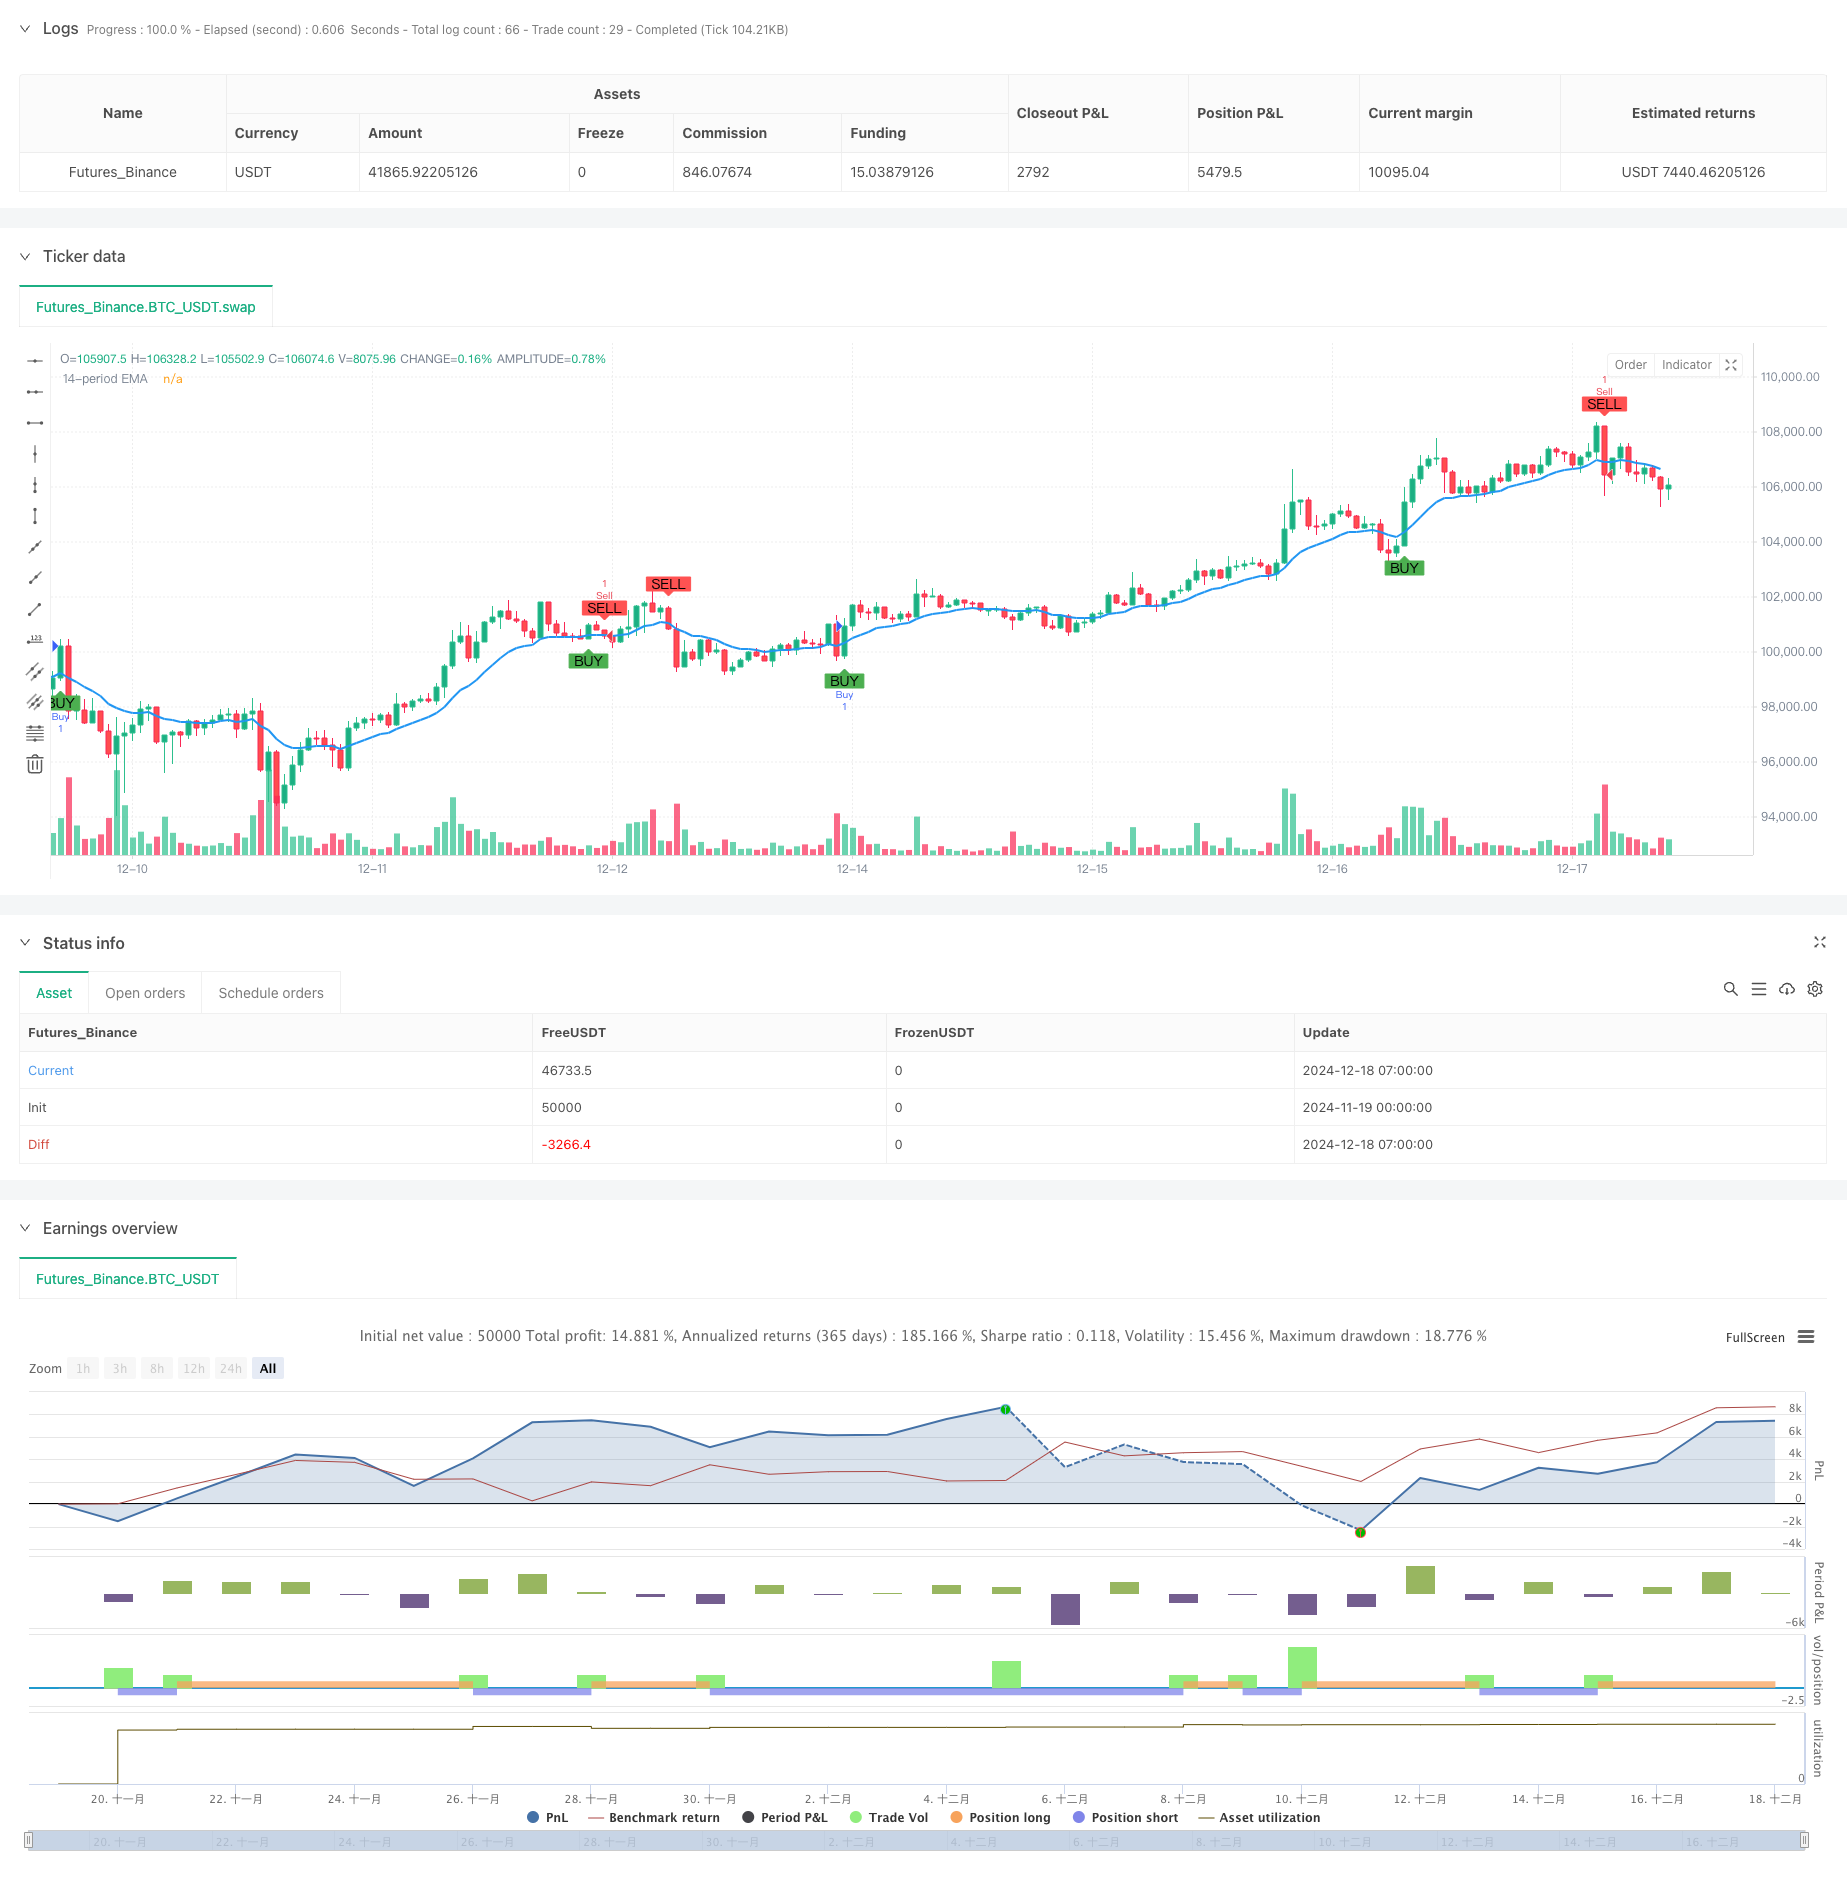
/*backtest
start: 2024-11-19 00:00:00
end: 2024-12-18 08:00:00
period: 1h
basePeriod: 1h
exchanges: [{"eid":"Futures_Binance","currency":"BTC_USDT"}]
*/

//@version=6
strategy("Buy and Sell Signals with EMA", overlay=true)

// Define the 14-period EMA
ema14 = ta.ema(close, 14)

// --- Buy Conditions ---
ema_length = input.int(14, title="EMA Length")

// Calculate the 14 EMA
ema_14 = ta.ema(close, ema_length)

// Calculate the candle body and wicks
body = close - open
upper_wick = high - close
lower_wick = open - low
total_candle_length = high - low

// Define the condition for the candle to be green (bullish)
is_green_candle = close > open

// Condition for crossing the 14 EMA (previous close was below, current close is above)
crossing_ema = ta.crossover(close, ema_14)

// Condition for at least 50% of the candle's body crossing the 14 EMA
body_crossed_ema = (close - open) * 0.5 <= (close - ema_14) and close > ema_14

// Condition for wick percent being less than or equal to 40% of the total candle length
wick_percent = (upper_wick + lower_wick) / total_candle_length
valid_wick_condition = wick_percent <= 0.4

// Define the buy condition
buy_condition = is_green_candle and crossing_ema and body_crossed_ema and valid_wick_condition

// --- Sell Conditions ---
candleIsRed = close < open
priceBelowEMA = close < ema14
prevLowAboveEMA = low[1] > ema14[1]  // Previous candle's low must be above the EMA
wickTooLarge = (low - math.min(open, close)) / (high - low) <= 0.2  // Lower wick should not exceed 20%

// Sell signal condition
sellSignal = priceBelowEMA and candleIsRed and prevLowAboveEMA and wickTooLarge

// --- Plotting ---
plot(ema14, color=color.blue, linewidth=2, title="14-period EMA") // Plot the 14-period EMA

// Plot the buy signal as an arrow on the chart
plotshape(buy_condition, color=color.green, style=shape.labelup, location=location.belowbar, text="BUY")

// Plot the sell signal as an arrow on the chart
plotshape(sellSignal, location=location.abovebar, color=color.red, style=shape.labeldown, title="Sell Signal", text="SELL")

// Optional: Add strategies for backtesting
if (buy_condition)
    strategy.entry("Buy", strategy.long)

if (sellSignal)
    strategy.entry("Sell", strategy.short)