Stratégie de trading quantitative de rupture d'intervalle SMA multiple et de verrouillage dynamique des bénéfices

Aperçu
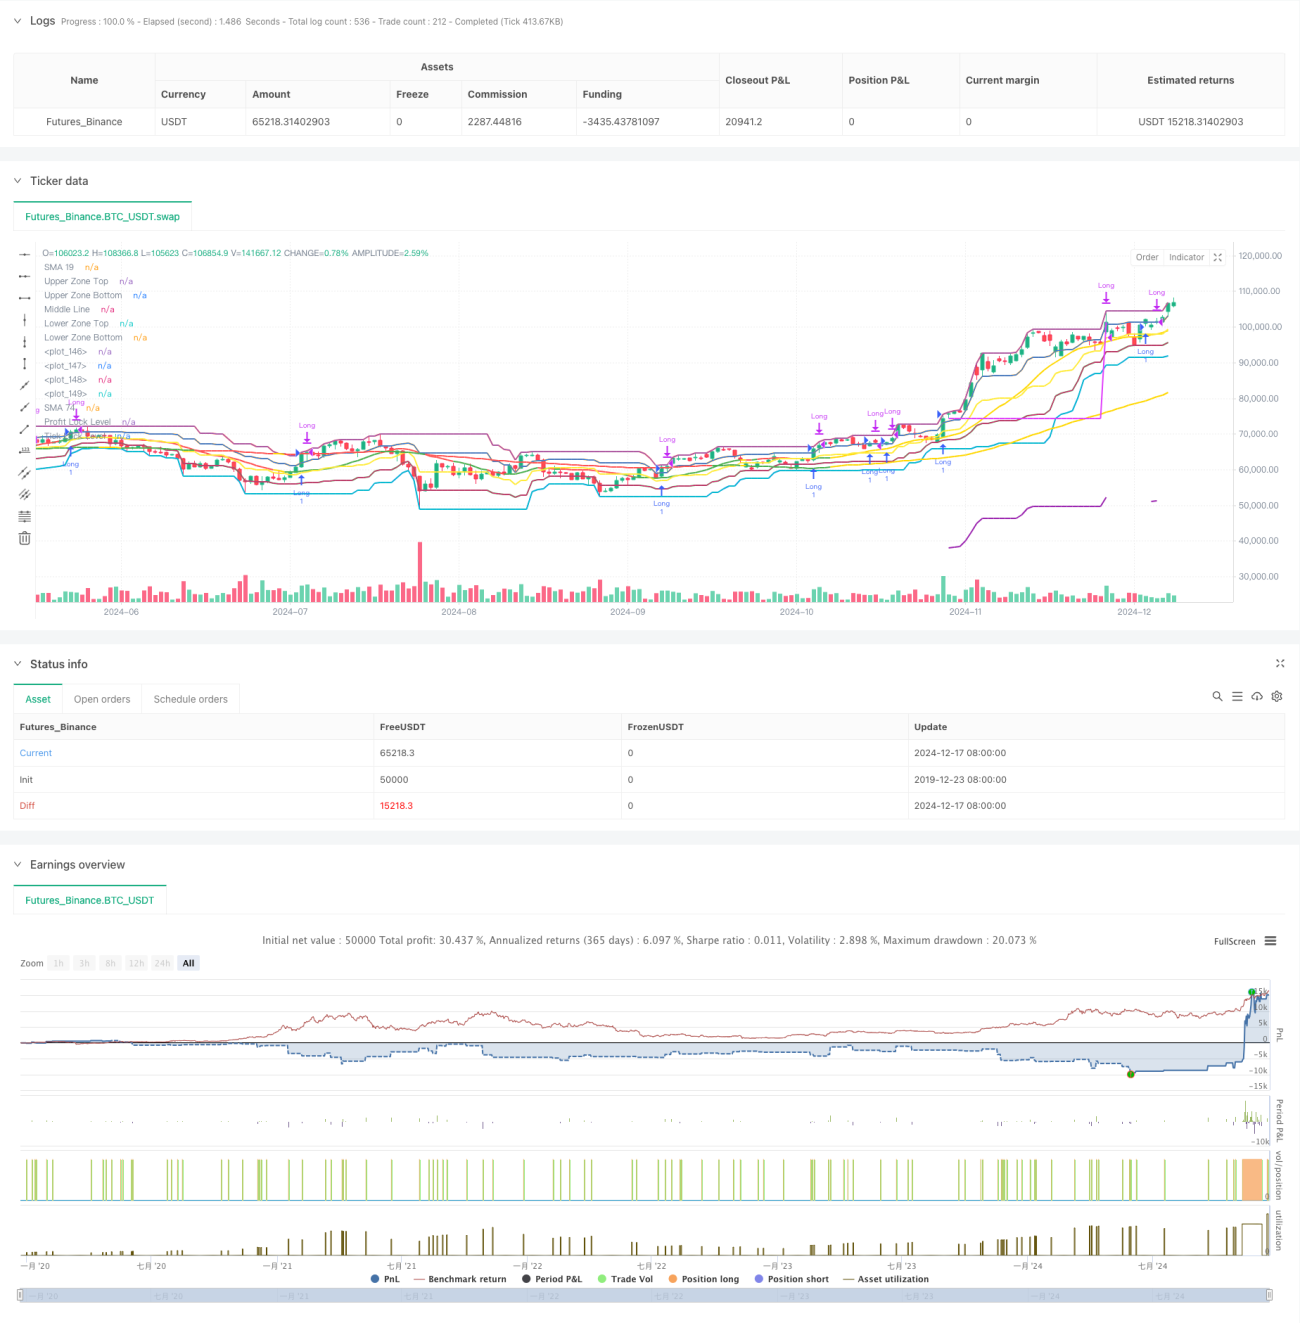
Il s'agit d'une stratégie de négociation de suivi de tendance dynamique basée sur les indicateurs SMA, combinée à des intervalles de prix, à des indicateurs aléatoires et à un mécanisme de protection de multiples bénéfices. La stratégie utilise des signaux croisés de mouvements de prix dans différents intervalles, combinés à des moyennes mobiles à court et à long terme, tout en utilisant des indicateurs aléatoires pour déterminer l'état du marché et la force de la tendance, permettant une capture de tendance efficace.
Principe de stratégie
La logique fondamentale de la stratégie comprend les éléments clés suivants :
- Construction d'un cadre de tendance à l'aide de 19 cycles et 74 cycles SMA
- L'état du marché est jugé à l'aide d'indicateurs aléatoires à 60 cycles, en divisant les couleurs du SMA en quatre états: jaune, vert, rouge et orange
- 5 niveaux importants dans la fourchette de prix pour juger de la force ou de la faiblesse des prix
- Les conditions d'entrée doivent être remplies en même temps :
- Le SMA est vert ou jaune
- Les prix dépassent la zone orange
- Le prix de clôture est au-dessus du SMA à court terme
- Il y a deux types d'arrêt:
- Retrait de la protection en pourcentage du prix le plus élevé
- Blocage des bénéfices sur base de points fixes
Avantages stratégiques
- Le mécanisme de confirmation multiple réduit les faux signaux
- Une division dynamique adaptée aux différents environnements de marché
- Le double frein permet une meilleure maîtrise des risques
- Une classification claire de l'état du marché aide à saisir le rythme du marché
- La surveillance de l'état des transactions en temps réel facilite le débogage des stratégies
- Combinaison d'indicateurs techniques et d'analyse du comportement des prix
Risque stratégique
- Une survente des transactions sur un marché en crise
- Le point fixe de l'arrêt de l'aiguille peut avoir été manqué
- L'optimisation des paramètres peut conduire à un surapprentissage
- Une reprise rapide du marché pourrait entraîner une perte de profit
- Les conditions de confirmation multiple peuvent avoir manqué certaines opportunités de transaction
La solution est simple:
- Ajout d'un filtre de fréquence
- Ajustez dynamiquement les paramètres d'arrêt
- Renforcer le mécanisme d’identification de l’environnement du marché
- Optimiser le timing des matchs
Orientation de l'optimisation de la stratégie
- Paramètres d'ajustement dynamique des indicateurs de volatilité
- Adaptation des conditions de blocage en fonction de l'état du marché
- Ajouter un mécanisme de confirmation du volume des transactions
- Ajouter un filtre de force de tendance
- Optimiser les méthodes de segmentation en tenant compte des caractéristiques du marché
- Améliorer les mécanismes de gestion des risques, tels que:
- Stop-loss par jour
- Contrôle de retrait maximal
- Limite de temps de détention
Résumer
La stratégie utilise plusieurs indicateurs techniques et méthodes d'analyse du comportement des prix pour construire un système de négociation complet. L'avantage de la stratégie réside dans les mécanismes de confirmation multiples et le système de freinage flexible, mais il faut également tenir compte de l'impact de l'environnement du marché sur la performance de la stratégie.
- 1