Aperçu
La stratégie est un système de trading de suivi de tendance avancé combinant des technologies d’intelligence artificielle, intégrant principalement les indicateurs de déviation et les méthodes de tendance WOW du VPS (système de prix fluctuant). Elle utilise le VPS pour identifier la volatilité du marché et l’intensité de la tendance, tout en combinant le déviation RSI pour détecter les points de revers potentiels.
Principe de stratégie
La stratégie est basée sur trois composantes principales:
- L’indicateur de tendance WOW est utilisé pour confirmer un changement de tendance (de la tête à la tête ou vice versa)
- Les conditions VPS sont utilisées pour vérifier la volatilité et la force de la tendance
- L’analyse de déviation du RSI est utilisée pour identifier les points de basculement potentiels
Le système calcule d’abord le canal de résistance au support dynamique basé sur l’ATR, en combinaison avec le paramètre de longueur VPS (par défaut 11) pour évaluer l’état du marché. Le système déclenche un signal de transaction lorsque le prix franchit le niveau de surachat (78) ou le niveau de survente (27). La stratégie surveille également les écarts entre le prix et l’indicateur VPS pour confirmer la direction de la transaction.
Avantages stratégiques
- Analyse multidimensionnelle: offre une vision plus complète du marché en combinant le suivi des tendances, la volatilité et l’analyse des divergences
- Adaptation: utilisation d’un canal ATR dynamique qui s’adapte automatiquement aux fluctuations du marché
- Gestion des risques: un mécanisme de stop-loss intégré, permettant une liquidation automatique des positions en fonction des objectifs de profit prédéfinis
- Mécanisme de confirmation du signal: plusieurs conditions doivent être remplies simultanément pour déclencher une transaction, ce qui réduit le risque de faux signaux
- Capacité de négociation bidirectionnelle: capture d’opportunités de négociation bidirectionnelles en plein essor, en profitant des fluctuations du marché
Risque stratégique
- Bruit de marché: risque de faux signaux dans des environnements à plat ou à basse volatilité
- Sensitivité des paramètres: les paramètres de l’indicateur (par exemple, la longueur du VPS, le niveau de surachat et de survente) ont un impact significatif sur la performance de la stratégie
- Risque de glissement: une plus grande influence de glissement est possible dans les transactions à court terme (par exemple, 5 minutes)
- Délai de signal: le mécanisme de confirmation multiple peut entraîner un retard de temps d’entrée
- Gestion des capitaux: la répartition des fonds fixes peut varier selon les conditions du marché
Orientation de l’optimisation de la stratégie
- Ajustement des paramètres dynamiques: un mécanisme de paramètres adaptatifs peut être introduit pour ajuster dynamiquement la longueur du VPS et les seuils de survente et de survente en fonction des conditions du marché
- Filtrage des environnements de marché: ajout d’un module de reconnaissance des environnements de marché pour suspendre les transactions dans des conditions de marché inappropriées
- Optimisation de l’arrêt des pertes: des mécanismes d’arrêt plus flexibles peuvent être conçus sur la base de l’ATR pour améliorer la précision du contrôle des risques
- Optimisation des tranches: caractéristiques, paramètres de stratégie et règles de négociation adaptés aux différentes périodes de négociation
- Optimisation de la gestion des fonds: mise en place d’une gestion dynamique des positions, adaptation de la taille des transactions en fonction de la volatilité du marché et de la situation de marge bénéficiaire
Résumer
Il s’agit d’une stratégie de négociation globale qui combine plusieurs indicateurs techniques et méthodes d’analyse. En combinant les technologies d’intelligence artificielle avec l’analyse technique traditionnelle, la stratégie est capable de fournir une plus grande précision de négociation tout en conservant la stabilité. Le principal avantage de la stratégie réside dans son mécanisme de confirmation de signal à plusieurs niveaux et son système de gestion du risque bien développé, tandis que le principal espace d’optimisation réside dans l’ajustement dynamique des paramètres et la reconnaissance de l’environnement du marché.
/*backtest
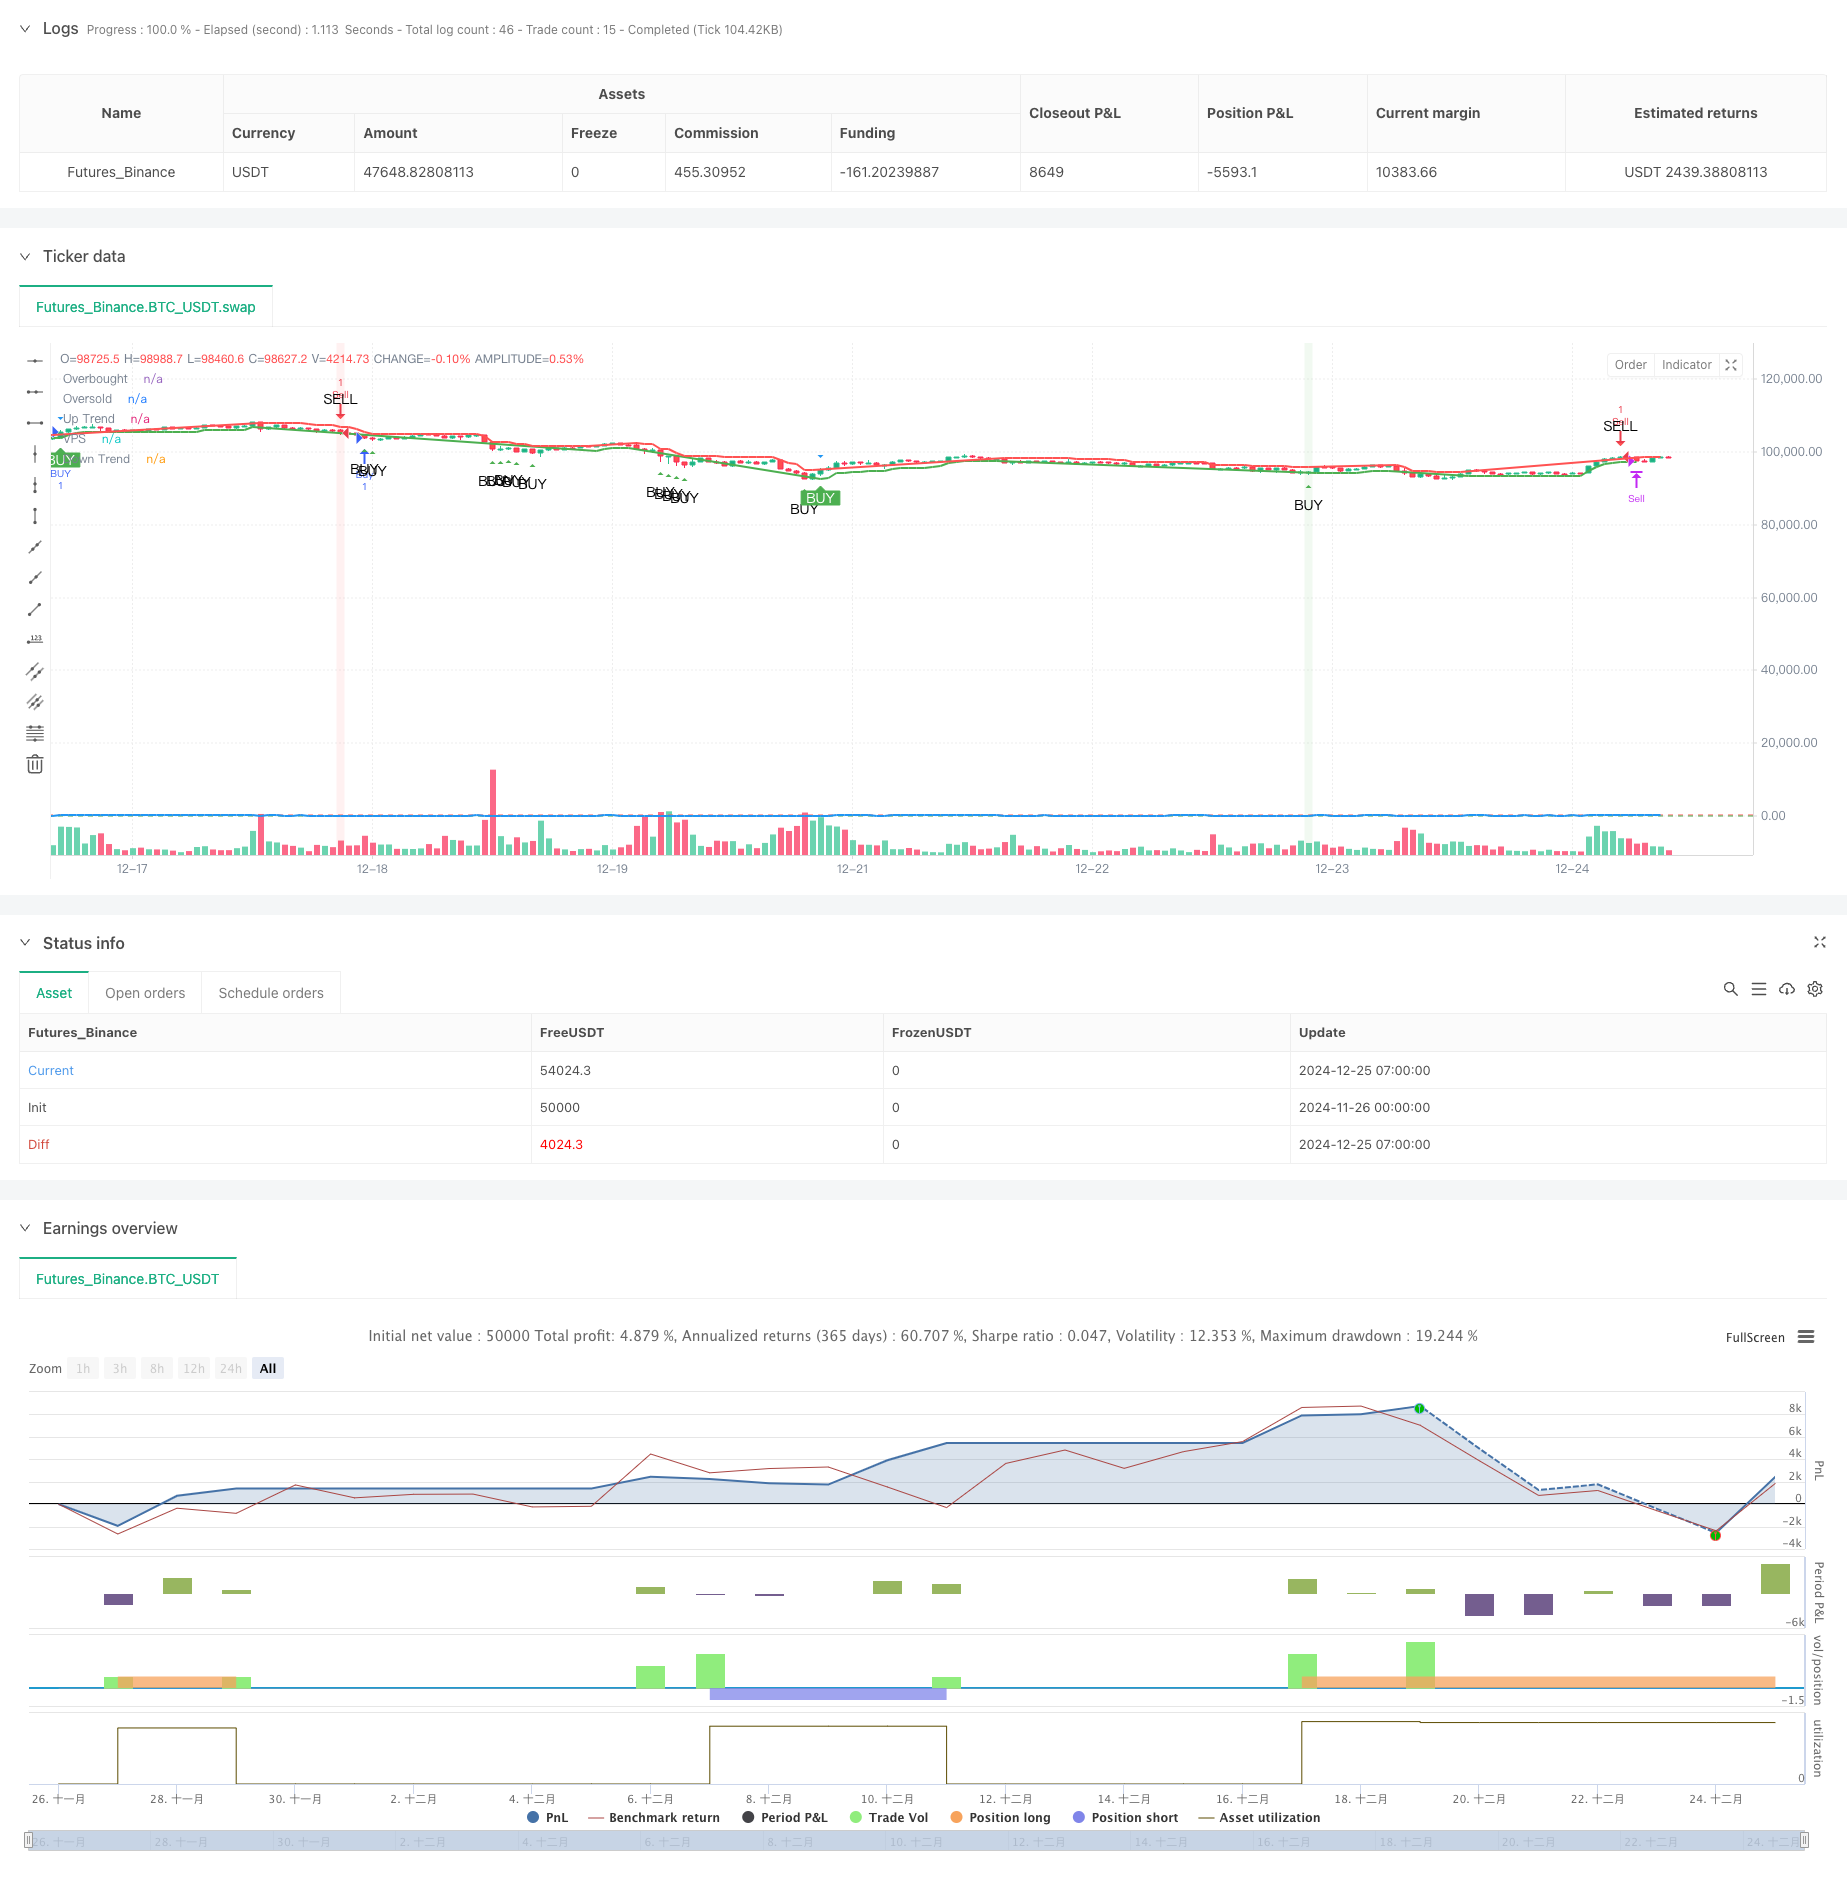
start: 2024-11-26 00:00:00
end: 2024-12-25 08:00:00
period: 1h
basePeriod: 1h
exchanges: [{"eid":"Futures_Binance","currency":"BTC_USDT"}]
*/
//@version=6
strategy("AI+VPS Vijay Prasad Strategy", overlay=true)
// --- VPS Divergence Strategy Inputs ---
vps_length = input.int(11, title="VPS Length")
vps_overbought = input.int(78, title="VPS Overbought Level") // Overbought level for VPS
vps_oversold = input.int(27, title="VPS Oversold Level") // Oversold level for VPS
// Calculate VPS (Relative Strength Index alternative) - here using a custom divergence condition
vps = ta.rsi(close, vps_length)
// Plot VPS on the chart
plot(vps, title="VPS", color=color.blue, linewidth=2)
hline(vps_overbought, "Overbought", color=color.red, linewidth=1)
hline(vps_oversold, "Oversold", color=color.green, linewidth=1)
// Define Buy and Sell Conditions based on Overbought/Oversold VPS
vps_buy_condition = vps < vps_oversold // Buy signal when VPS is oversold
vps_sell_condition = vps > vps_overbought // Sell signal when VPS is overbought
// Define Bullish and Bearish Divergence conditions
bullish_divergence = (low[1] < low[2] and vps[1] > vps[2] and low < low[1] and vps > vps[1])
bearish_divergence = (high[1] > high[2] and vps[1] < vps[2] and high > high[1] and vps < vps[1])
// Combine Buy and Sell signals:
// Buy when VPS is oversold or Bullish Divergence occurs
vps_buy_condition_final = vps_buy_condition or bullish_divergence
// Sell when VPS is overbought or Bearish Divergence occurs
vps_sell_condition_final = vps_sell_condition or bearish_divergence
// Plot Buy and Sell Signals
plotshape(series=vps_buy_condition_final, title="VPS Buy Signal", location=location.belowbar, color=color.green, style=shape.triangleup, text="BUY")
plotshape(series=vps_sell_condition_final, title="VPS Sell Signal", location=location.abovebar, color=color.red, style=shape.triangledown, text="SELL")
// VPS Divergence Highlight
bgcolor(bullish_divergence ? color.new(color.green, 90) : na) // Highlight background for Bullish Divergence
bgcolor(bearish_divergence ? color.new(color.red, 90) : na) // Highlight background for Bearish Divergence
// Strategy: Buy and Sell with target
if vps_buy_condition_final
strategy.entry("Buy", strategy.long)
if vps_sell_condition_final
strategy.entry("Sell", strategy.short)
// Capital settings for the strategy (for backtesting purposes)
capital_per_trade = input.float(1000, title="Capital per Trade (INR)", minval=1)
buy_target_inr = 1500 // Profit target for Buy in INR
sell_target_inr = 1000 // Profit target for Sell in INR
trade_value = close * (capital_per_trade / close) // Value of one contract at current price
// Profit threshold calculation
buy_profit_target = buy_target_inr / trade_value // Profit in price movement for Buy
sell_profit_target = sell_target_inr / trade_value // Profit in price movement for Sell
// Exit based on profit targets
if strategy.position_size > 0
profit_inr = (close - strategy.position_avg_price) * strategy.position_size
if profit_inr >= buy_target_inr
strategy.close("Buy", comment="Profit Target Reached")
if strategy.position_size < 0
profit_inr = (strategy.position_avg_price - close) * -strategy.position_size
if profit_inr >= sell_target_inr
strategy.close("Sell", comment="Profit Target Reached")
// --- WoW Trends + VPS (Vijay Prasad Strategy) Logic ---
Periods = input.int(title="ATR Period", defval=10)
src = input.source(close, title="Source")
Multiplier = input.float(title="ATR Multiplier", step=0.1, defval=1.7)
changeATR = input.bool(title="Change ATR Calculation Method ?", defval=true)
showsignals = input.bool(title="Show Buy/Sell Signals ?", defval=true)
// --- ATR Calculation ---
atr2 = ta.sma(ta.tr, Periods)
atr = changeATR ? ta.atr(Periods) : atr2
up = src - (Multiplier * atr)
up1 = na(up[1]) ? up : up[1]
up := close[1] > up1 ? math.max(up, up1) : up
dn = src + (Multiplier * atr)
dn1 = na(dn[1]) ? dn : dn[1]
dn := close[1] < dn1 ? math.min(dn, dn1) : dn
// --- WoW Trends Logic ---
var trend = 1
trend := na(trend[1]) ? 1 : trend
trend := trend == -1 and close > dn1 ? 1 : trend == 1 and close < up1 ? -1 : trend
// --- VPS Logic (Vijay Prasad Strategy) ---
vpsVolatilityCondition = (high - low) > (1.5 * ta.sma(ta.tr, 20)) // VPS condition based on volatility
vpsTrendCondition = trend == 1 // VPS condition to check if trend is up
vpsSignal = vpsVolatilityCondition and vpsTrendCondition // Combine both VPS conditions
// --- Buy/Sell Signal Logic ---
buySignal = trend == 1 and trend[1] == -1 // Signal to Buy (when trend switches to up)
sellSignal = trend == -1 and trend[1] == 1 // Signal to Sell (when trend switches to down)
// --- Combined Buy/Sell Signal Logic (WoW Trends + VPS) ---
combinedBuySignal = buySignal and vpsSignal
combinedSellSignal = sellSignal and vpsSignal
// --- Plot WoW Trends Lines using plot() ---
plot(trend == 1 ? up : na, title="Up Trend", color=color.green, linewidth=2)
plot(trend == -1 ? dn : na, title="Down Trend", color=color.red, linewidth=2)
// --- Plot VPS Signals ---
plotshape(vpsSignal and showsignals, title="VPS Signal", text="VPS", location=location.abovebar, style=shape.triangledown, size=size.small, color=color.blue, textcolor=color.white)
// --- Plot Combined Buy/Sell Signals ---
plotshape(combinedBuySignal and showsignals, title="Combined Buy Signal", text="BUY", location=location.belowbar, style=shape.labelup, size=size.small, color=color.green, textcolor=color.white)
plotshape(combinedSellSignal and showsignals, title="Combined Sell Signal", text="SELL", location=location.abovebar, style=shape.labeldown, size=size.small, color=color.red, textcolor=color.white)
// --- Strategy Entries ---
if (combinedBuySignal)
strategy.entry("BUY", strategy.long)
if (combinedSellSignal)
strategy.entry("SELL", strategy.short)
// --- Highlight Bars for Buy/Sell Signals ---
barcolor(combinedBuySignal ? color.green : na, offset=-1)
barcolor(combinedSellSignal ? color.red : na, offset=-1)