Stratégie de suivi des tendances dynamiques multi-indicateurs basée sur l'EMA et la SMA

Aperçu de la stratégie
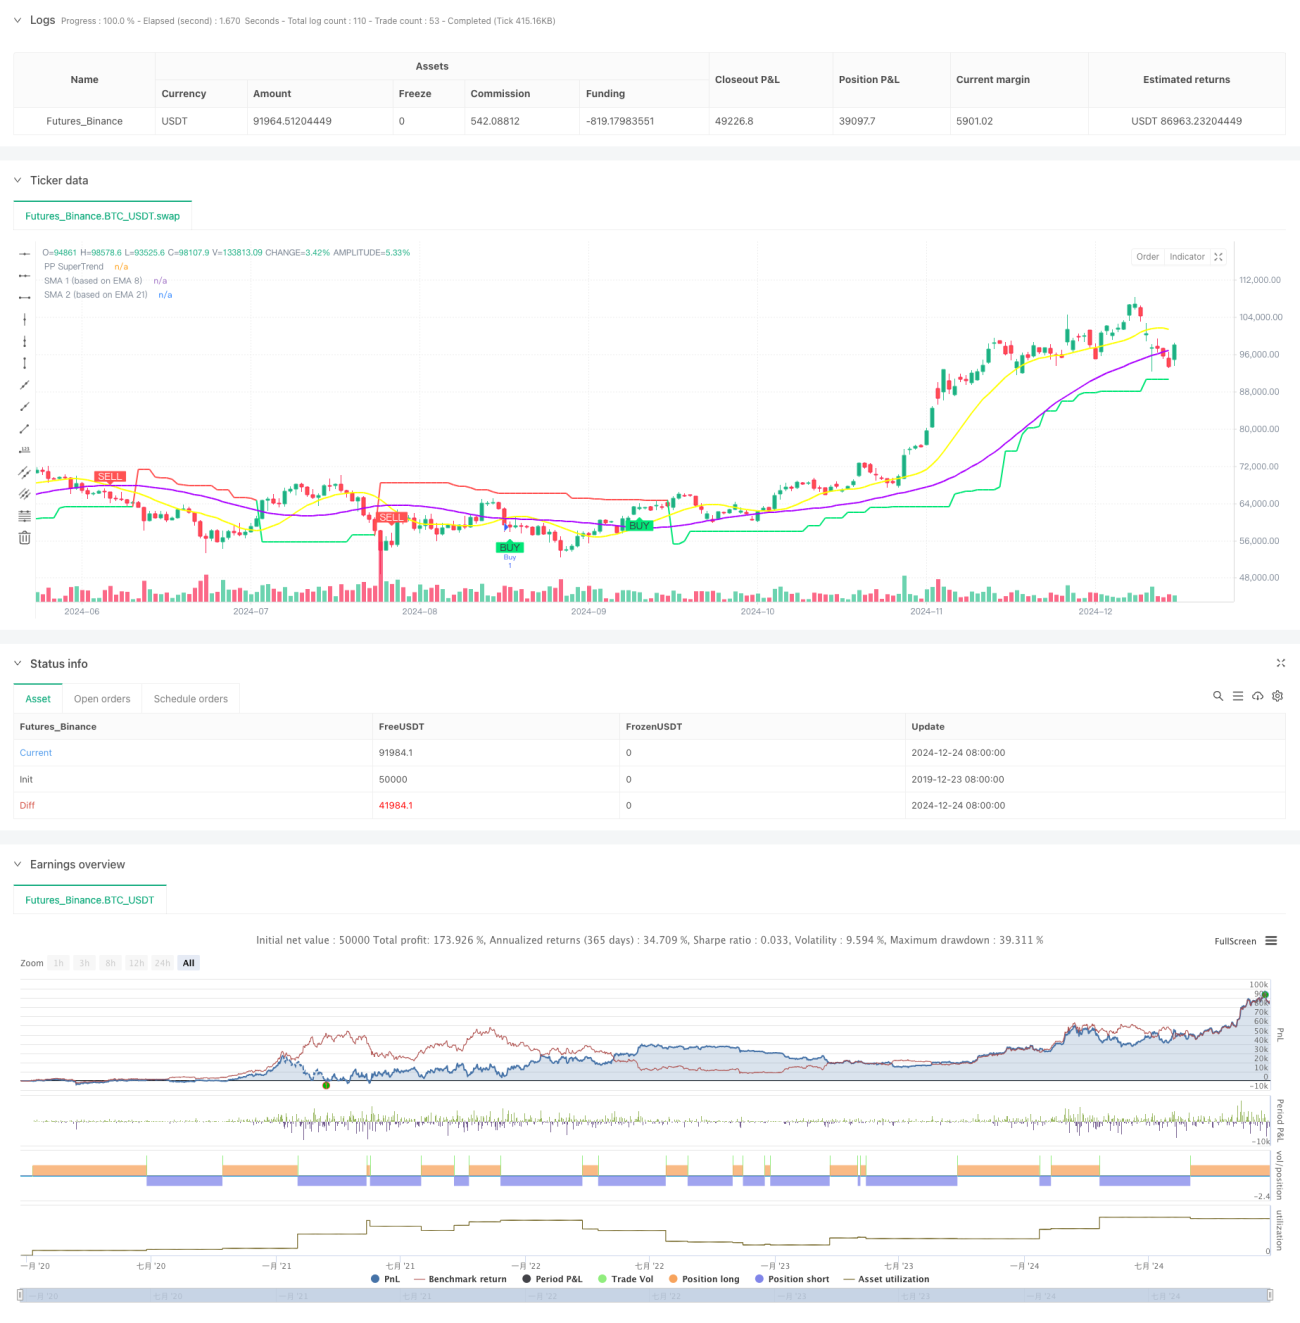
La stratégie est un système de suivi de tendance dynamique combinant plusieurs indicateurs techniques. Elle identifie les tendances du marché et les opportunités de négociation en intégrant des points pivots, des indicateurs SuperTrend et des signaux croisés de moyennes mobiles. La caractéristique centrale de la stratégie est l'utilisation d'une méthode d'analyse à des périodes de temps fixes, assurant la cohérence du signal tout en améliorant la fiabilité du signal de négociation par la vérification des points pivots.
Principe de stratégie
La stratégie repose sur les mécanismes fondamentaux suivants :
- Utilisez des données de prix de périodes fixes pour l'analyse afin d'éviter les interférences de différentes périodes
- Le SMA est calculé à partir des EMA de 8 cycles et de 21 cycles, formant la base du suivi de la tendance
- L'indicateur SuperTrend, combiné à l'ATR et au comptage des points de repère, est utilisé pour confirmer la direction de la tendance
- Les signaux de croisement SMA n'ont été considérés comme valides que s'ils sont apparus dans les 3 cycles de la position pivot
- Calcul dynamique et suivi des niveaux de support/résistance pour les décisions de négociation
Avantages stratégiques
- Vérification croisée de multiples indicateurs pour améliorer la fiabilité du signal
- Analyse des cycles de temps fixes pour réduire les fausses interférences
- Mécanismes de vérification ponctuels pour s'assurer que les transactions se déroulent à des niveaux de prix critiques
- Suivi dynamique des points de résistance de support pour aider à déterminer la position de l'arrêt de perte
- L'utilisation des indicateurs SuperTrend fournit une confirmation supplémentaire de la direction de la tendance
- Réglages de paramètres flexibles qui peuvent être ajustés en fonction des différentes conditions du marché
Risque stratégique
- Plusieurs indicateurs peuvent entraîner un décalage du signal
- Le marché horizontal pourrait générer de faux signaux
- L'analyse des périodes de temps fixes peut manquer des signaux importants pour d'autres périodes
- Les mécanismes de vérification ponctuelle peuvent vous faire rater des opportunités commerciales importantes
- L'optimisation excessive des paramètres peut entraîner une suradaptation
Orientation de l'optimisation de la stratégie
- Introduction d'un mécanisme de filtrage de la volatilité pour réduire la fréquence des transactions pendant les périodes de faible volatilité
- Indicateurs de confirmation de force de tendance à la hausse, tels que l'ADX ou le MACD
- Développer un système de paramètres adaptatifs qui s'adaptent à la dynamique du marché
- Ajoutez une analyse du volume des transactions pour améliorer la fiabilité du signal
- Mise en place d'un mécanisme de stop-loss dynamique qui permet d'ajuster les positions de stop-loss en fonction des fluctuations du marché
Résumer
Cette stratégie crée un système de trading de suivi des tendances relativement complet grâce à la combinaison de multiples indicateurs techniques. Son avantage central est d'améliorer la fiabilité du signal grâce à l'analyse des périodes de temps fixes et à la vérification des points de repère. Bien qu'il existe un certain risque de retard, il peut être efficacement contrôlé par des mesures d'optimisation des paramètres et de gestion des risques.
- 1