Croisement de moyennes mobiles multiples combiné au système de trading de tendance de support et de résistance de Camarilla

Aperçu
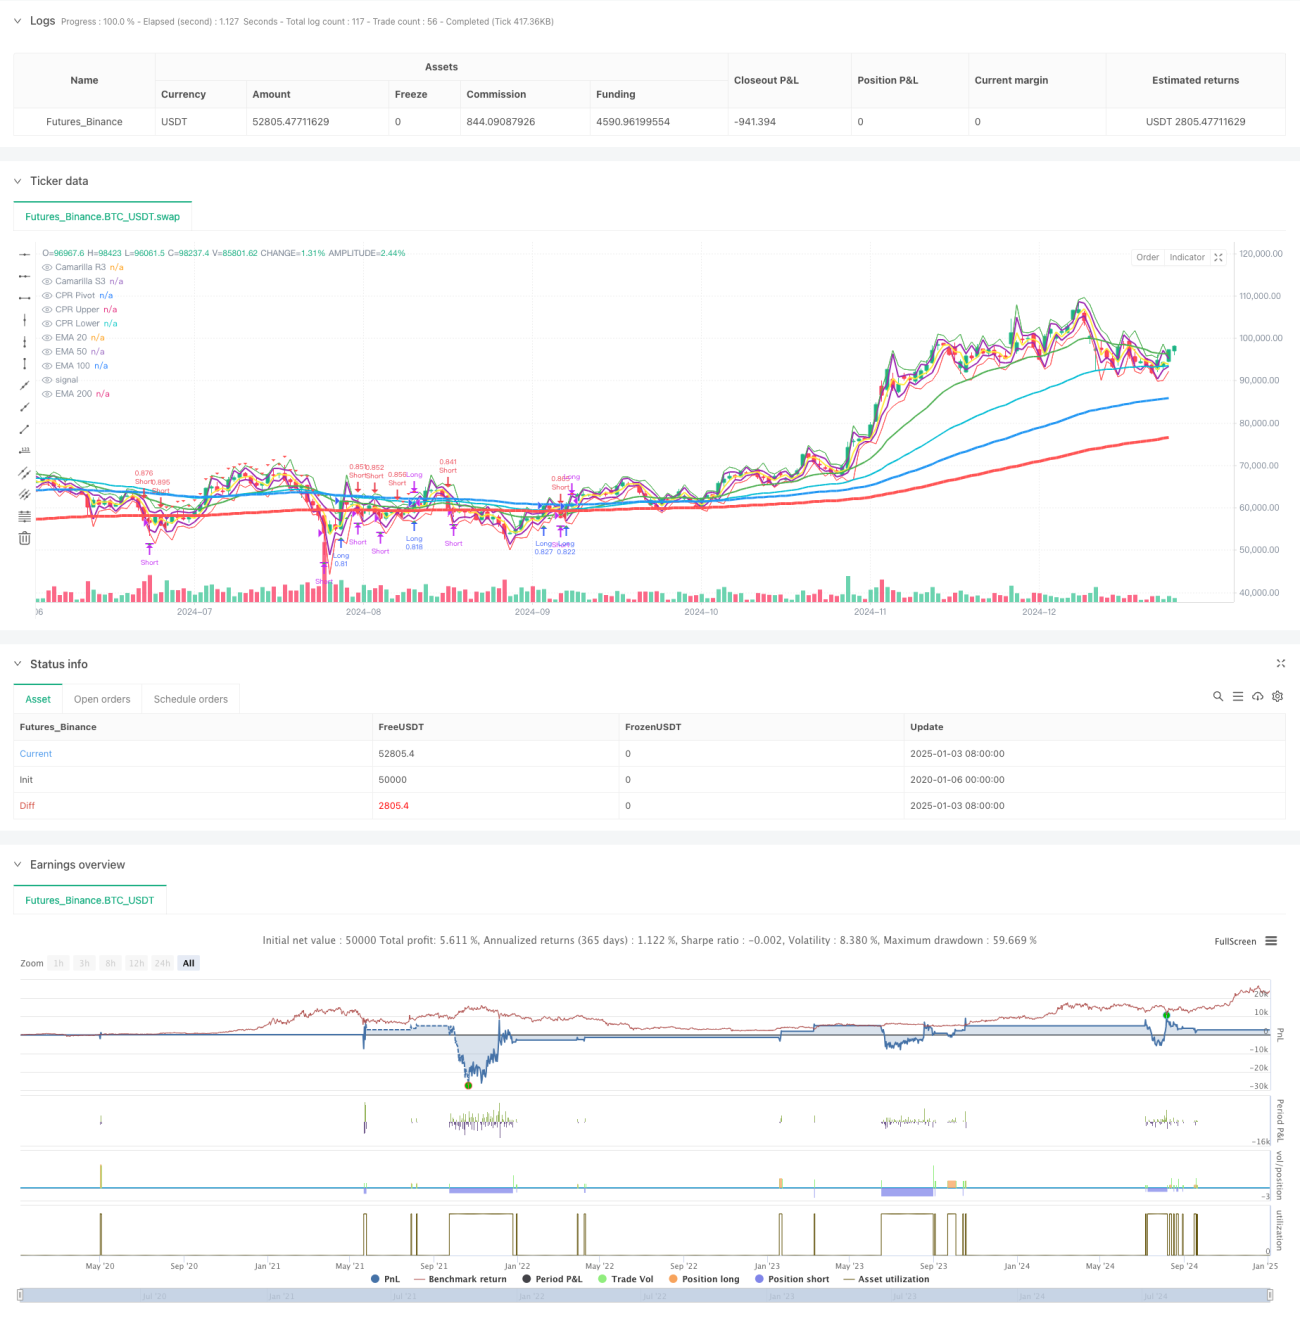
Cette stratégie est un système de trading de suivi de tendance qui combine plusieurs moyennes mobiles exponentielles (EMA), les niveaux de support et de résistance de Camarilla et la plage pivot centrale (CPR). La stratégie identifie les tendances du marché et les opportunités de trading potentielles en analysant le prix par rapport à plusieurs moyennes mobiles et à des fourchettes de prix importantes. Le système adopte des mesures strictes de gestion des fonds et de contrôle des risques, notamment la taille des positions en pourcentage et des mécanismes de sortie diversifiés.
Principe de stratégie
La stratégie repose sur les éléments fondamentaux suivants :
- Le système de moyennes mobiles multiples (EMA20/50/100/200) est utilisé pour confirmer la direction et la force de la tendance
- Les niveaux de support et de résistance de la Camarilla (R3/S3) sont utilisés pour identifier les niveaux de prix clés
- La fourchette de prix centrale (CPR) est utilisée pour déterminer la fourchette de négociation intrajournalière.
- Les signaux d'entrée sont basés sur le croisement du prix avec l'EMA200 et la confirmation par l'EMA20
- Les stratégies de sortie incluent des points fixes et des modes de mouvement en pourcentage
- Le système de gestion de fonds ajuste dynamiquement la taille de la position en fonction de la taille du compte
Avantages stratégiques
- La combinaison d'indicateurs techniques multidimensionnels fournit des signaux de trading plus fiables
- Mécanisme de sortie flexible pour s'adapter aux différents environnements de marché
- Un système de gestion de fonds parfait contrôle efficacement les risques
- Les fonctionnalités de suivi des tendances aident à capturer les grands mouvements
- Les composants de visualisation permettent aux traders de mieux comprendre la structure du marché
Risque stratégique
- De faux signaux peuvent survenir sur des marchés volatils
- Plusieurs indicateurs peuvent entraîner des signaux de trading retardés
- Les points de sortie fixes peuvent ne pas être performants sur des marchés volatils
- Un fonds de plus grande taille est nécessaire pour résister aux baisses
- Les coûts de transaction peuvent affecter le rendement global de la stratégie
Orientation de l'optimisation de la stratégie
- Introduire des indicateurs de volatilité pour ajuster dynamiquement les paramètres d'entrée et de sortie
- Ajoutez un module de reconnaissance du statut du marché pour s'adapter aux différents environnements de marché
- Optimiser le système de gestion des fonds et ajouter une gestion dynamique des positions
- Ajout d'un filtre de temps de négociation pour améliorer la qualité du signal
- Envisagez d’ajouter une analyse de volume pour améliorer la fiabilité du signal
Résumer
Cette stratégie construit un système de trading complet en intégrant plusieurs outils d'analyse technique classiques. Les avantages du système résident dans une analyse de marché multidimensionnelle et une gestion stricte des risques, mais il doit également prêter attention à son adaptabilité à différents environnements de marché. Grâce à une optimisation et une amélioration continues, la stratégie devrait améliorer la rentabilité tout en maintenant la stabilité.
- 1