
Aperçu
Cette stratégie est un système de trading avancé qui combine l'oscillateur WaveTrend avec les bandes de moyenne mobile EMA. En intégrant ces deux indicateurs techniques, une stratégie de trading est formée qui peut capturer avec précision les points de retournement des tendances du marché. La stratégie adopte des paramètres dynamiques de stop-profit et de stop-loss, recherchant des rendements plus élevés tout en protégeant la sécurité du capital.
Principe de stratégie
Le cœur de la stratégie consiste à identifier les signaux de trading grâce à la coordination de l'indicateur WaveTrend et des huit moyennes mobiles EMA. L'indicateur WaveTrend mesure l'état de surachat ou de survente du marché en calculant l'écart entre le prix et la moyenne mobile. La bande moyenne mobile EMA confirme la direction de la tendance en croisant les moyennes mobiles de différentes périodes. Spécifiquement:
- Lorsque l'EMA2 croise l'EMA8, ou qu'un signal triangulaire bleu apparaît (EMA2 croise l'EMA3) et qu'il n'y a pas de motif de losange sanguin, un signal long est déclenché.
- Lorsque l'EMA8 croise l'EMA2 ou qu'un motif en forme de diamant sanglant apparaît, un signal court est déclenché.
- Le réglage du stop loss utilise le point extrême après le signal inverse précédent, ce qui permet de contrôler efficacement le risque
- L'objectif de profit est fixé à 2 à 3 fois la distance du stop loss, ce qui reflète un bon rapport risque-rendement
Avantages stratégiques
- Le mécanisme de double confirmation améliore la fiabilité des signaux de trading
- Les paramètres de stop loss dynamiques peuvent mieux s'adapter aux fluctuations du marché
- Avec un ratio risque/rendement clairement défini
- L'utilisation des bandes de moyenne mobile EMA permet de déterminer la tendance générale du marché
- L'indicateur WaveTrend peut identifier efficacement les conditions de marché surachetées et survendues
- La logique de la stratégie est claire, facile à comprendre et à mettre en œuvre
Risque stratégique
- Des faux signaux peuvent fréquemment se produire sur des marchés volatils
- Le stop loss dynamique peut être facilement déclenché lors de fluctuations volatiles
- Les indicateurs qui s’appuient sur des données historiques peuvent échouer lorsque le marché change radicalement.
- L'utilisation de plusieurs indicateurs techniques peut entraîner des signaux retardés
Solution:
- Des filtres de volatilité peuvent être ajoutés pour réduire les faux signaux sur les marchés volatils
- Envisagez d'utiliser un paramètre de stop loss plus lâche
- Ajouter un mécanisme de confirmation de la force de la tendance
Orientation de l'optimisation de la stratégie
- Introduire des indicateurs de volatilité du marché (tels que l'ATR) pour ajuster dynamiquement la distance du stop loss
- Ajoutez un mécanisme de confirmation du volume pour améliorer la fiabilité du signal
- Envisagez d'ajouter un filtre de force de tendance pour trader uniquement sur les marchés à forte tendance
- Optimiser les paramètres WaveTrend pour mieux s'adapter aux différents environnements de marché
- Étudier la synergie des signaux à différentes périodes de temps
Résumer
Il s'agit d'un système de trading complet qui combine le suivi des tendances et les oscillateurs issus de l'analyse technique. En utilisant les bandes moyennes mobiles WaveTrend et EMA en combinaison, vous pouvez non seulement saisir la tendance générale, mais également entrer sur le marché à temps au tournant de la tendance. Le mécanisme de gestion dynamique du stop-profit et du stop-loss confère à la stratégie de bonnes capacités de contrôle des risques. L’espace d’optimisation de la stratégie réside principalement dans l’amélioration du filtrage du signal et de la gestion des risques.
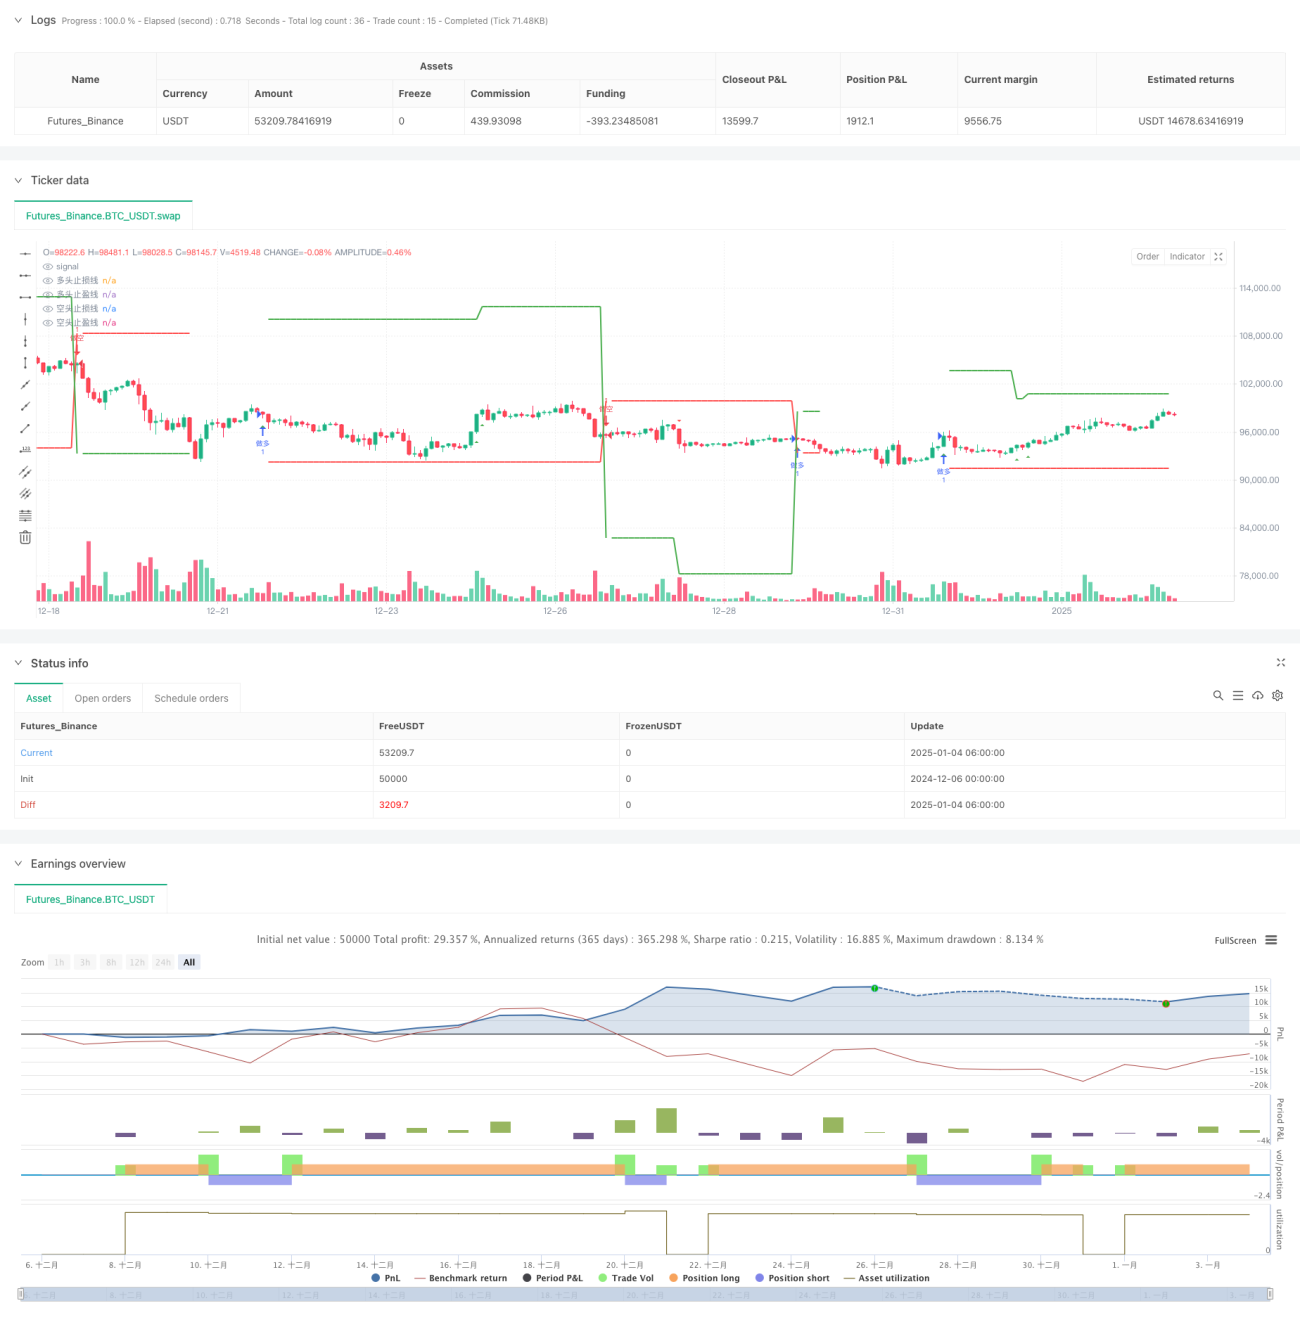
/*backtest
start: 2024-12-06 00:00:00
end: 2025-01-04 08:00:00
period: 2h
basePeriod: 2h
exchanges: [{"eid":"Futures_Binance","currency":"BTC_USDT"}]
*/

//@version=5
strategy("VuManChu Cipher A Strategy", overlay=true, initial_capital=10000, default_qty_type=strategy.fixed, default_qty_value=1.0)

// === 函数定义 ===- 1